Data Acquisition and User Interface for Scintillating Sodium Iodide Radiation Detectors
William Chen, Victor Luo
Introduction
This summer, our team was focused on developing tools to interface with and collect data from the NaI (Sodium Iodide) Scintillation Detectors. We are using this sensor because it is more accurate than the CsI (Cesium Iodide) detector, and compact enough to be portable.

The NaI Detector
Data Acquisition
We utilize the PMT-2000 by Bridgeport Instruments for data acquisition from the detectors.
Interface
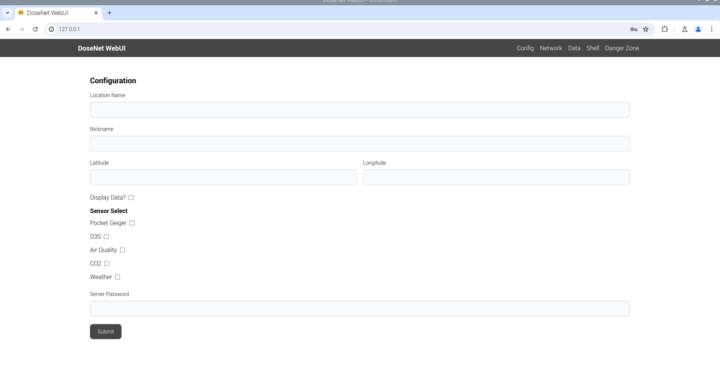
The user interface features 3 tabs. The first tab configures the data acquisition. Buttons to initialize sensor-Pi communication, change the number of channels, adjust the dwell time, and begin data uploading are all present here. The second tab features a continuously updating graph of the spectra collected by the sensor. The third tab features relevant information like counts and dose. The interface is compatible with both the PMT-2000 and PMT-1000, and was built using Tkinter.
The bottom section of the detector is a scintillating crystal, which glows with intensity proportional with the energy contained in radiation interactions. The Photo-MultiplierTube (PMT) on top of the detector can interpret signal data and export the information to a computer system.
Field Testing
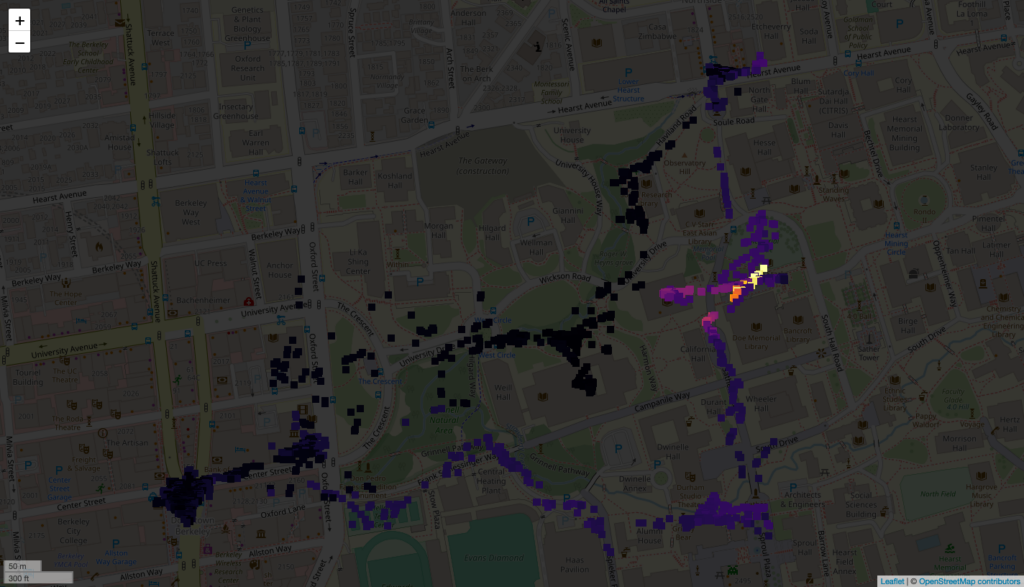
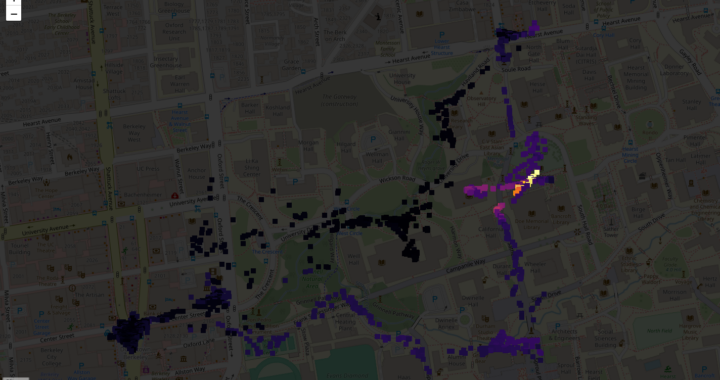
We took a 90-minute walk through the Berkeley campus to gather data and test the mapping software. After visiting Main Stacks & the BART station (Berkeley Downtown), we gathered over 3000 data points, visualized here:

A map of NaI detection points around UC Berkeley Campus
As the map suggests, we found Main Stacks to be more radioactive than any of the other sites we visited.
Calibration
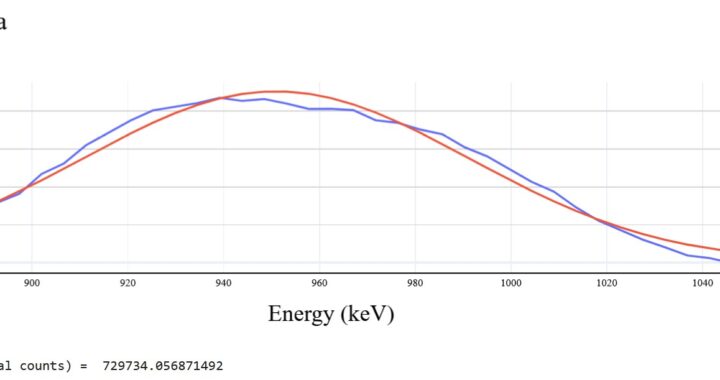
In order to produce more useful measurements, the sensor was calibrated against a radioactive norm sample, to determine a conversion factor between counts generated by the sensor per second and an equivalent dose rate in micro Sieverts and micro Roentgen per hour. The conversion factor can be seen to the right, with a percent error of 3.68%.
| Conversion Factor Units | |
|---|---|
| 0.004017040654 | uSv/hr / cps |
| 0.4017040654 | uR/hr / cps |
Dropbox
To be able to use the sensor in a stationary manner, the device is connected to Dropbox, where data will be uploaded. A larger, more complete file is updated every 24 hours, and a smaller, more up-to-date file is updated every hour, and wiped every 24 hours when the larger file is updated. The two files together contain all data collected prior to the last hour.
Stationary System Installation
The NaI sensor is currently on the roof, where it is constantly collecting data and uploading to Dropbox.

Current Testing of NaI Detector on the roof of Etcheverry Hall


