

Timeseries of our air monitor station data. Don't understand how to interpret these plots? We have provided a Plotting Reference to help read the plots.
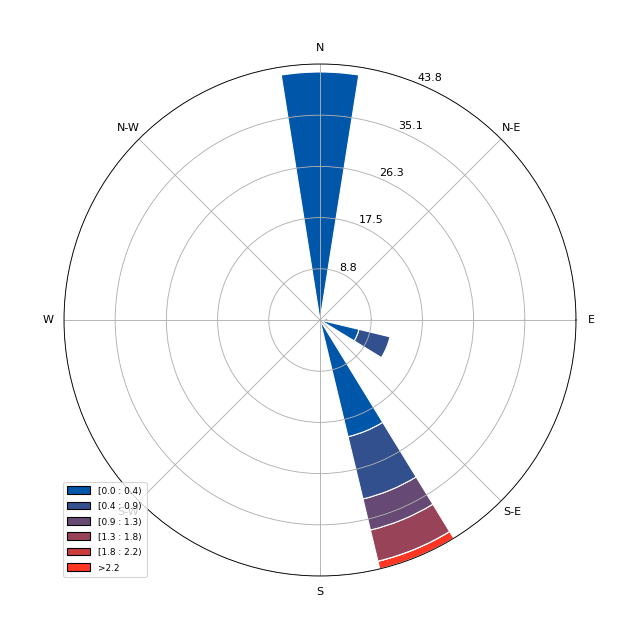
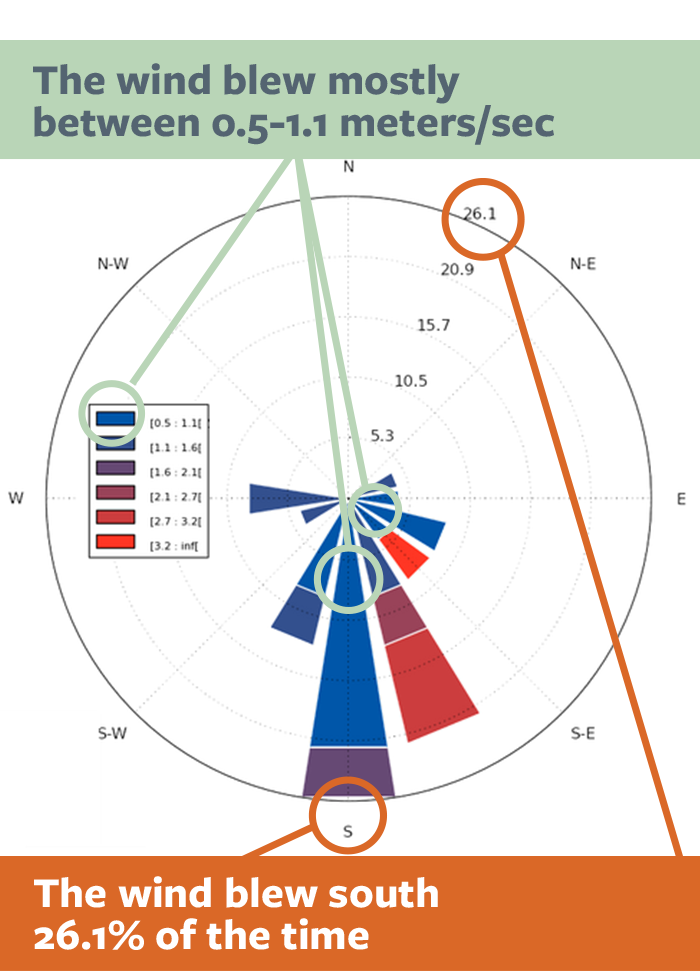
This is a windrose for the time period selected. A windrose is a graph depicting which direction winds blow from as well as indicating the speed measured for data points in that direction. A detailed explanation can be found in the Plotting Reference. (Please note the speeds reported in the table are in meters per second).

Need a spectrum? Here's the past hour's acquisition. See the Technical Details for why we don't track all peaks.
Still have questions? Contact Us!
Reading Realtime Charts
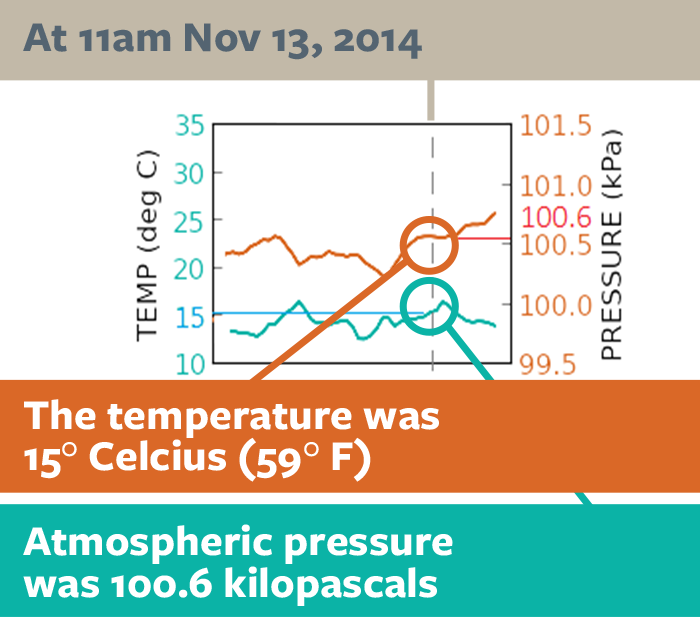
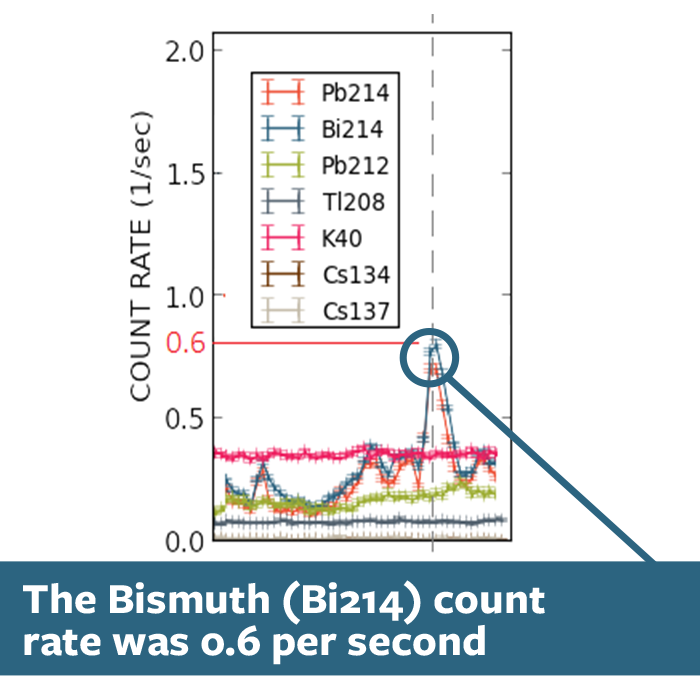
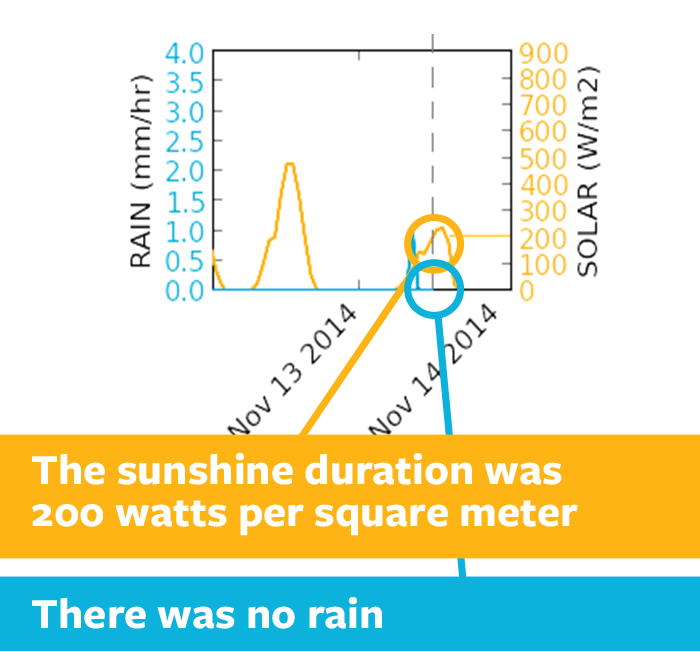
Below, please find an example of one day's charts with key points explained.
System Details
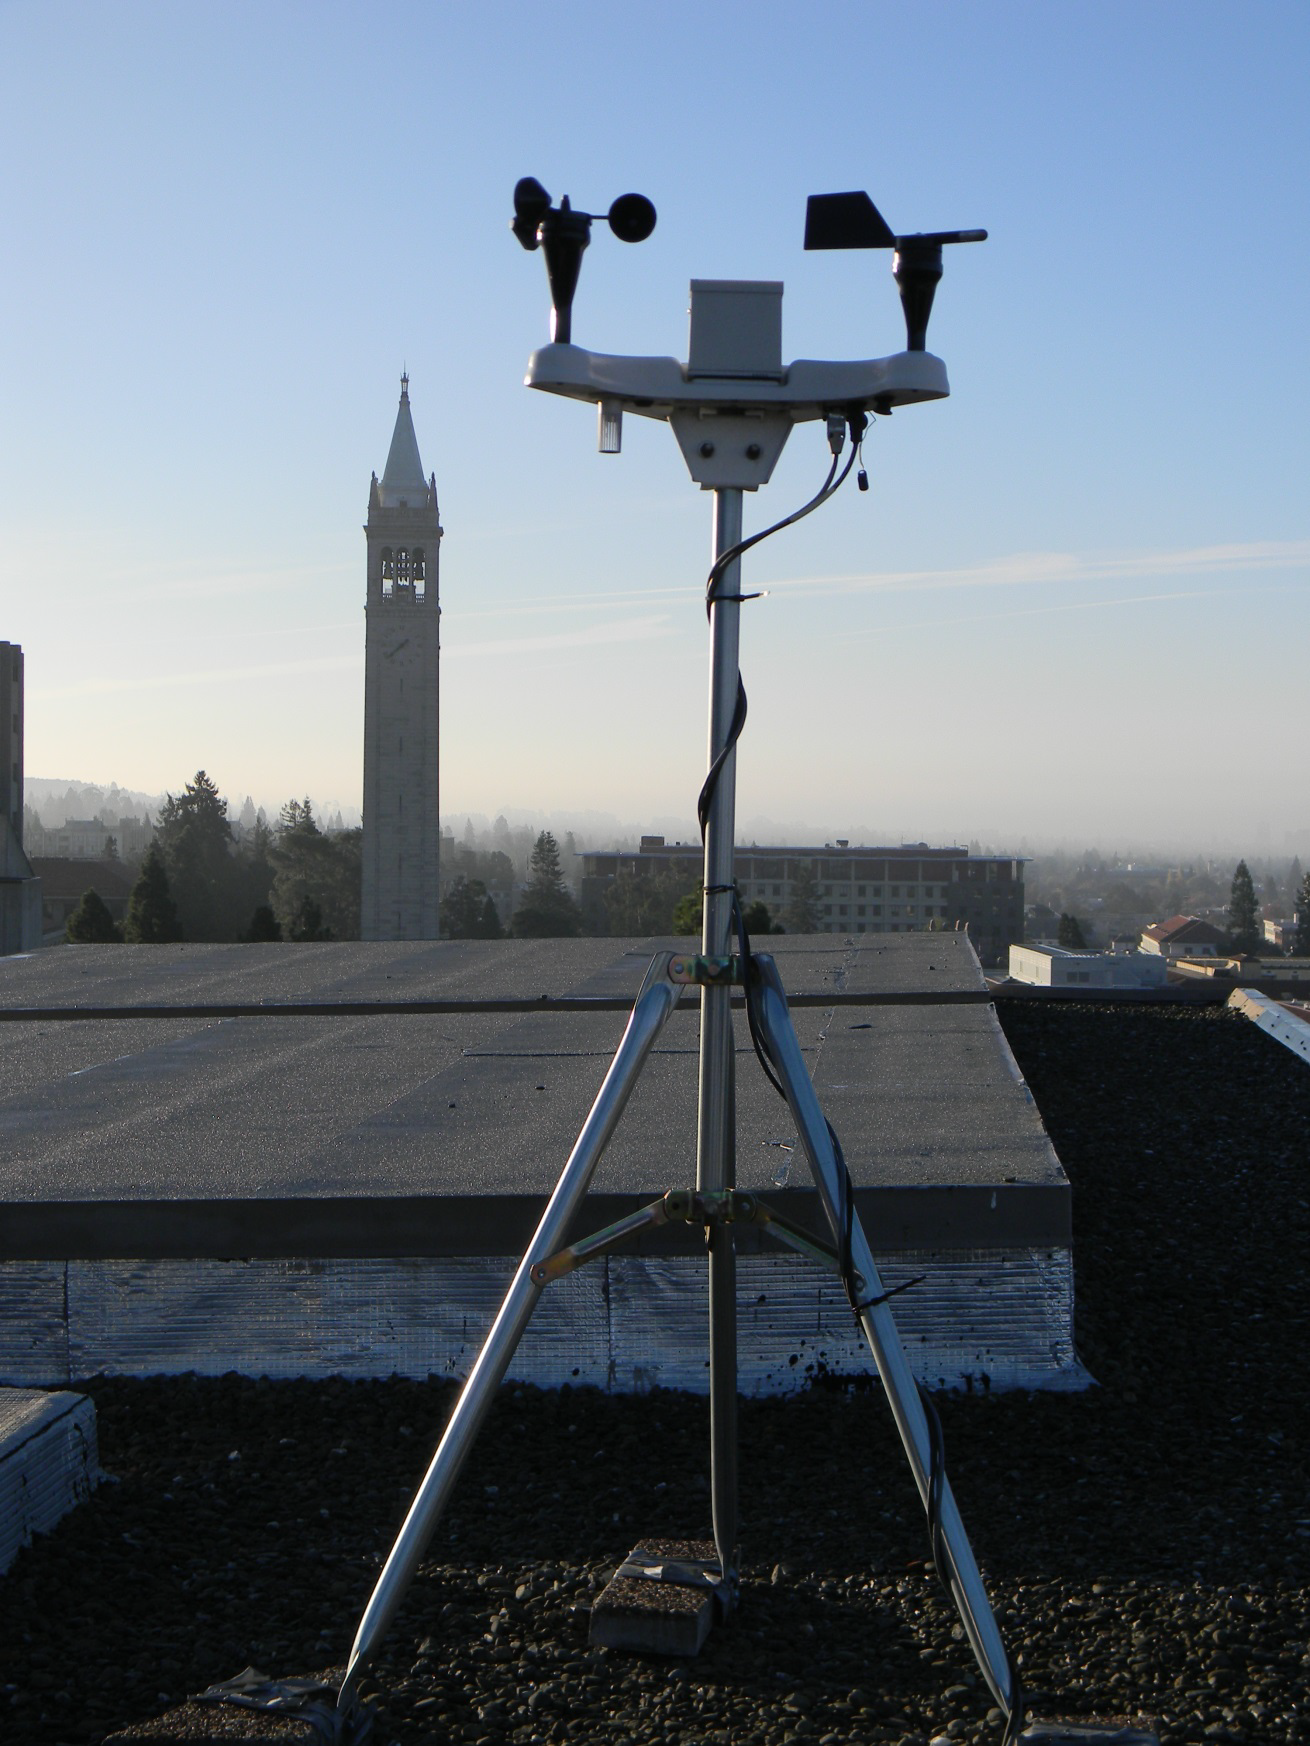
Fig 1. Our air monitor on a roof at UC Berkeley collects particles in the air, which includes natural radioactivity.
We pump air through an air flow control system onto a HEPA filter (Fig. 3) to collect and concentrate particulates from the air. We count the filter with a radiation spectrometer and post our results automatically to the site. To learn more about our system, visit the technical details page.
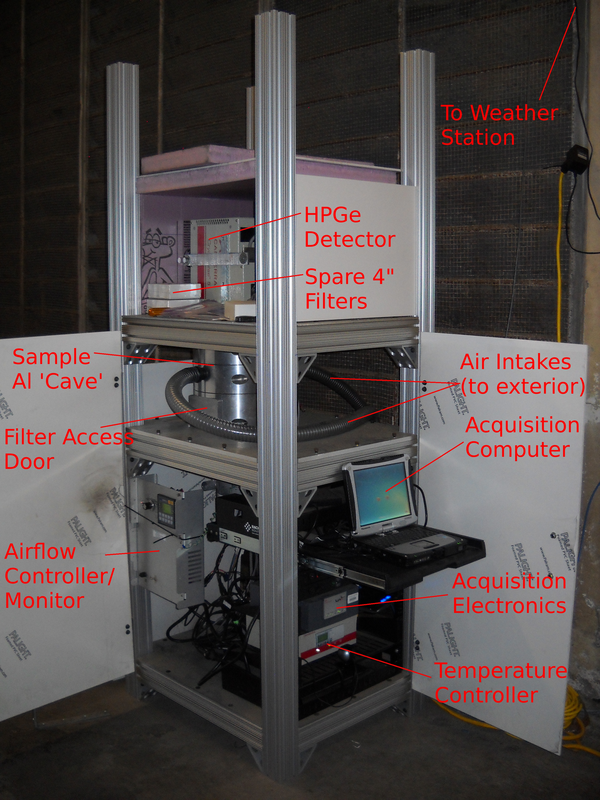
Fig 2. The radiation spectrometer detection system used for sampling.
The airmonitor is pictured in Figure 2. This system is in general more specific and more sensitive than a Geiger counter. It provides very high quality information that Geiger counters simply do not produce, including identifying the particular radioactive materials being transported in the air.
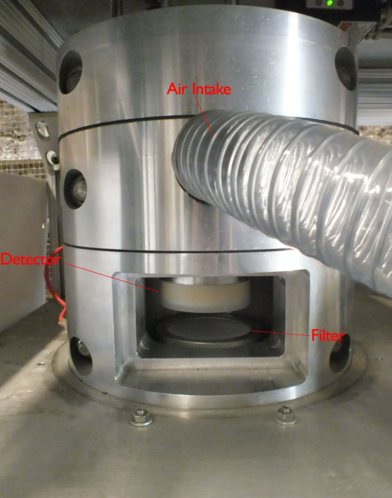
Fig 3. HEPA filter and radiation detector for air monitor.