

Why do the air radioactivity levels vary so much?
222Rn is the dominant component of the radioactivity in the air, and how much radon there is at any time can rapidly change depending on the weather conditions. This system will explore rain, solar, wind, humidity, and barometric pressure.
To understand these variations, we have placed a weather station right next to our air sampling system. Can you find any correlations between radon progeny and weather?
Health effects
Radon gas and its decay products are breathed in by humans every day, and this has been happening for millennia. The dose from radon and its decay products give humans an estimated 50% of our background dose. High levels of radon (e.g., in basements with poor ventilation) have been linked to lung cancer, and radon is believed to be the second biggest cause of lung cancer after smoking and ahead of secondhand smoke. An estimated 21,000 people die from radon-caused lung cancer each year. For the source of these data and more info, see the EPA Radon health risks page.
The US Environmental Protection Agency recommends action if indoor radon concentrations exceed 4 picocuries per liter (pCi/L), which is 150 Becquerels per cubic meter (Bq/m3). Typical indoor levels are lower, at 1.4 pCi/L (52 Bq/m3). Typical outdoor levels are even lower: 0.4 pCi/L (1.5 Bq/m3).
Data Transparency
The data we provide represents the conditions we are currently experiencing in our monitor. We do not selectively present data. This is possible because we do not bear the burden of public safety as the EPA or CDHP does. Our purpose is the education of the public. If we believe that data is not representative of the system we reserve the right to revise the analysis in order to make our presentation more accurate. Changes will always seek to improve the quality of the results presented.
System Description
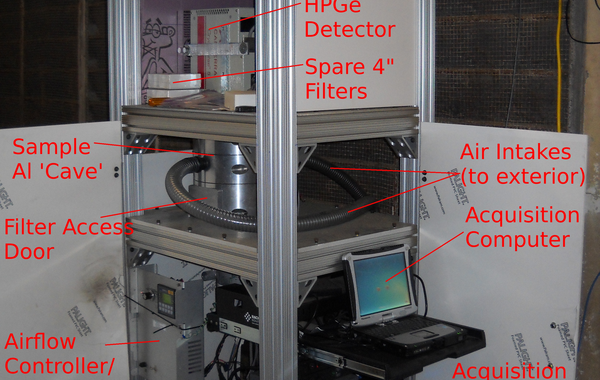
The air sampler that we have constructed forces 21SCFM of air through a 4" diameter HEPA filter. The FPAE-102 filter collects 99.99%DOP 0.3um particles. Each filter is run for approximately 3days. During this time the filters are continuously assayed by a mechanically cooled, n-type high purity germanium detector. This detector has superior energy resolution and efficiency, even at ~10keV energies. We are thus sensitive to radiation in the 3keV-3000keV energy range. Spectra are collected every 5min while weather data is collected from our commercial weather station. These data are collected, aligned with respect to timestamps, and stored in a database. Data is transferred to a server that performs the necessary analysis to produce the displayed data.
The sampler sets at about the same height as the Berkeley Campanile lookout.
Data Analysis
Currently, spectra are processed by integrating over hour time periods and extracting net peak counts. The live-time of the system is used to estimate the count rate in the peak and that is plotted on the main time-series graphic. Note that these spectra are not 'background' subtracted and do include radioisotopes in materials surrounding our detector.
The selection of isotopes to include in the time-series plot is driven first by the total contribution to the spectra. The majority of these lines tend to be Naturally Occurring Radioactive Material (NORM). Of particular interest are the natural decay chains that begin with 238U and 232Th. Additionally, we are interested in what we call Technically Enhanced NORM. These are isotopes that are of man-made origin but are a part of the total terrestrial dose that humans receive. One such isotope is 137Cs which is present from the atmospheric testing of nuclear bombs. We include isotope trackers for isotopes that are of particular interest based on current events.