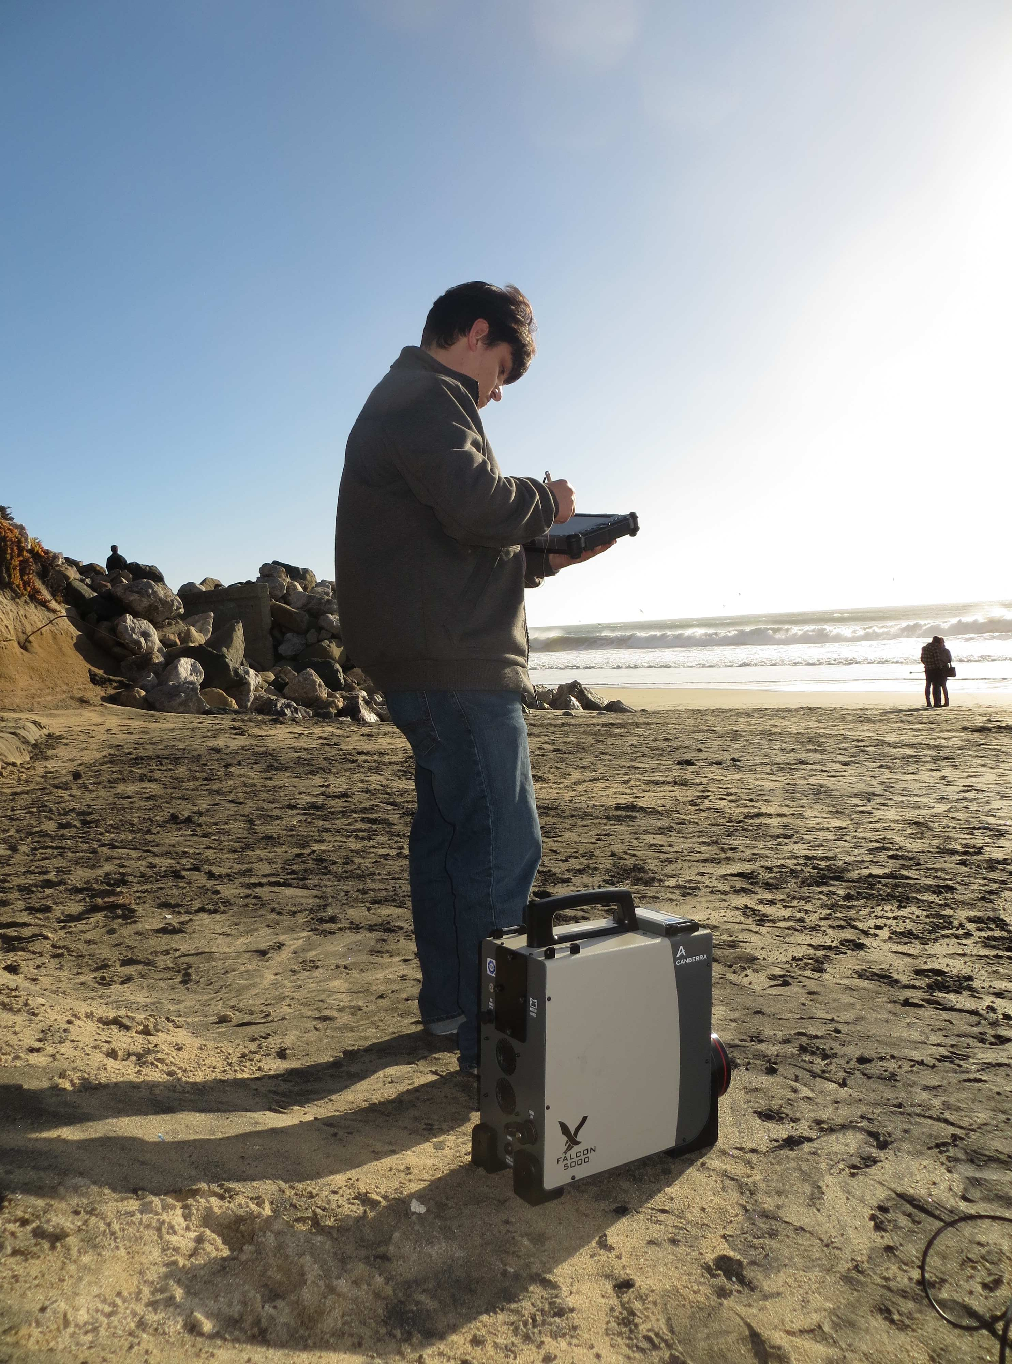
Natural radioactivity has been a part of the Earth since it formed. Learn about where radiation comes from, and the main ways we are exposed to radioactivity. The RadWatch team takes environmental measurements to support research projects and to help inform the public about radiation in our environment.

rad101-1

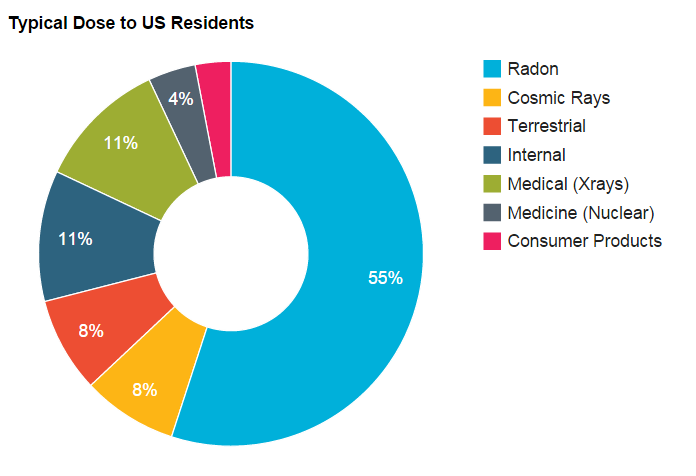
Radiation exposure/dose per year depends on life choices—however the average, healthy US citizen receives about 360 millirem of dose per year.

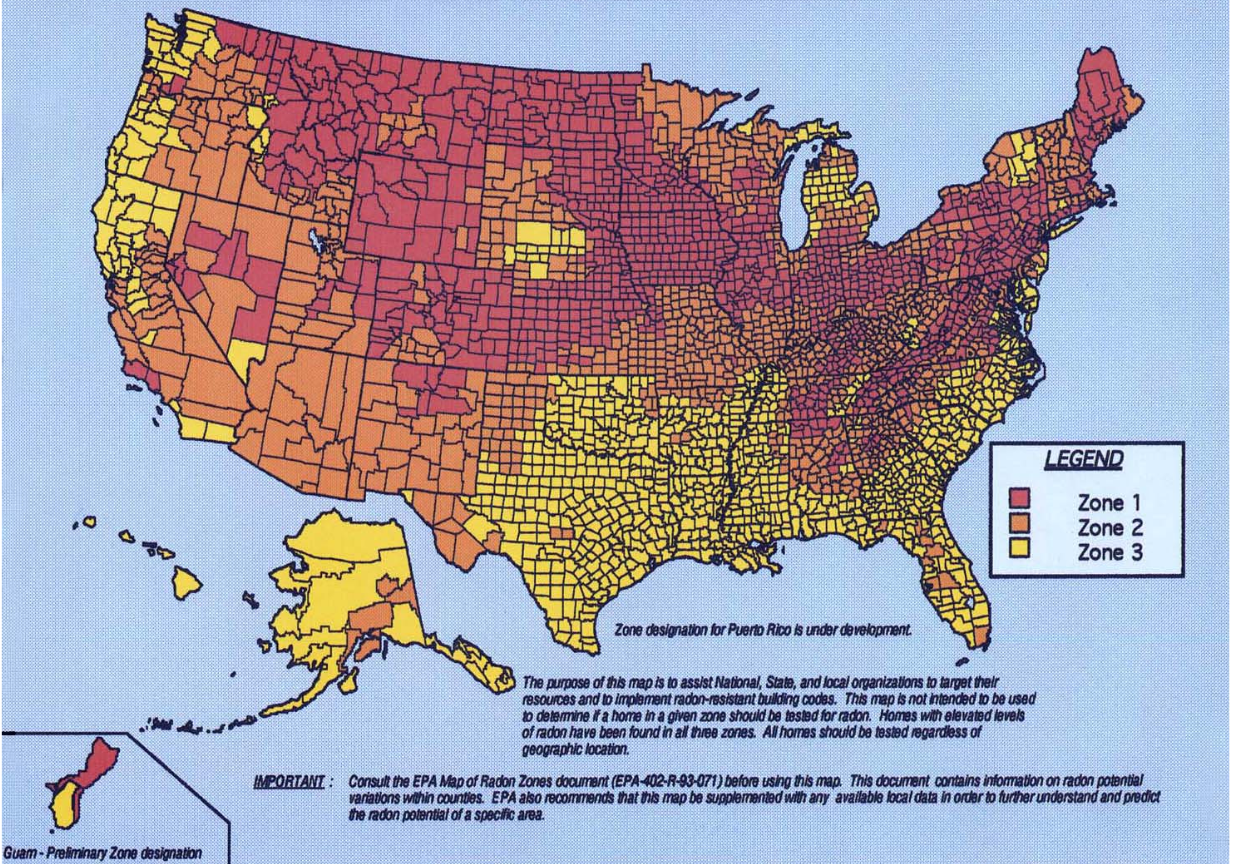
Airborne/radon, cosmic, terrestrial, and internal/food dose exposures are all due to naturally occurring radioactive materials and sources. 82% of the average US citizen's exposure is from natural sources!

NRCP93 (1987) data. For non-'healthy' individuals who get CT scans or other nuclear medicine diagnostics performed the total dose on average is almost double.

What radiation sources am I exposed to?
rad101-2

Radon delivers over half the dose that healthy US citizens receive on an annual basis.

As a colorless gas and a natural product of radioisotopes found in the Earth, radon emanates from the ground and can collect in poorly ventilated indoor or low lying areas. In these poorly maintained environments, radon can pose a health risk. Zone 1 on the map above finds the geological and life style factors that would be most susceptible to radon build up, however radon is naturally found in the air at varying concentrations.

EPA's map of elevated indoor radon risk. This map takes into account geological and lifestyle habbits that make radon more or less important in certain regions.

Airborne Radiation: Radon
rad101-3

The Earth’s crust contains several naturally occurring primordial radioisotopes.

These radioisotopes include 238U, 232Th and 40K. These contribute to our natural exposure through the upper 20-80cm of the earth’s surface.

USGS graph of the computed terrestrial gamma ray flux at 1m from the ground. Duval, Joseph S., Carson, John M. et al.

Terrestrial Radiation
rad101-4

Cosmic rays are another form of naturally occurring radiation that is generated in the upper atmosphere.

High energy particle collisions produce particle cascades that have increasing intensity with higher altitude in the biosphere. Plane flights, for example, increase the amount of cosmic ray exposure a person receives because of the higher cosmic ray intensity.

Cosmic shower images from NASA. These interactions are generated in the upper atmosphere by high energy cosmic particles. Graphic by Simon Swordy.

Cosmic Radiation
rad101-5

Radioactive materials can be found in our food chain.

Naturally occurring radioactive materials have the same chemistry as their stable analogues. As such, naturally occurring radioactive materials are part of our environment and are found in many elements of our food chains.

Fish from a local Berkeley market. This is part of our "Current Sampling".

Radiation in the Body: Food
rad101-6

Medical imaging and nuclear medicine are widely used for diagnostics and treatments.

These methods typically rely on x-rays or nuclear radiation physics to generate 2&3D images of biological systems.
Medical CT imaging contributes a large fraction of the total average dose to humans. (If one includes this factor the total average dose a person receives is almost doubled.)

Medical CT and angiograms are both sources of dose to individuals getting medical treatments. Over the last 20yrs CT has become very popular and now accounts for half the average dose to US citizens.

Nuclear Medicine and Medical Procedures
rad101-7

The RadWatch team takes air, food, and water samples to measure and study radiation in our environment.

These samples correspond to the transport methods that radioisotopes from Fukushima could reach the West Coast. Food and water samples are from the immediate Bay Area. Our sister project KelpWatch samples Kelp from the majority of the California coast. Air sampling is performed by the RadWatch Air Monitor. This is a system that can identify radioisotopes in the air. There are no longer any definitive signs of Fukushima in these measurements. Testing these samples provides a band of variance that natural radiation falls into and can serve as a database for radionuclides in the environment.

RadWatch Project: What We Test
rad101-8

The DoseNet team works with communities and educators around the world to provide radiation data collection tools.

Radiation and environmental data is collected across the network and available to all. Tools for displaying and understanding this data are available through DoseNet. We focus on building connections with K-12 schools across our network and establishing relationships with teachers to provide in-class, hands-on activities to compliment data collected through our network.

DoseNet Project: A Community-based Network
rad101-9

Community concerns led researchers to test the beach at Half Moon Bay, investigating possible contamination from Fukushima radiation.

RadWatch team member Ryan Pavlovsky explains that this plot on Google Earth shows the approximate Geiger count rate on the beach approach. Misidentified as Fukushima radiation, the count rate increase is simply due to naturally occurring radioactive materials in the beach geology. This demonstrates the band of variation seen in the natural, radioactive world.

RadWatch Case Study: Half Moon Bay

How does this system differ from a Geiger counter?.

This is a very good question. The detectors used for RadWatch activities can distinguish Fukushima radioisotopes from background radiation. They can address the question "Are there definitive indicators of Fukushima radiation in my environment?" Geiger counters cannot do this. Additionally our detectors are, in general, much more specific and sensitive.

previous arrow
next arrow

Return to Main Page