Obtaining Counts From NaI Sensors
Justin E
Overview
The Berkeley DoseNet project utilizes Sodium iodide (NaI) scintillation detectors for gamma radiation detection. In order to obtain accurate measurement values with noise deduction applied, a series of novel algorithms are developed for gamma spectra peak detection, energy calibration, peak isolation, and energy calculation. In this research report, methods for these algorithms are discussed with results presented, and areas for future improvement are proposed.
Introduction
The Sodium iodide (NaI) scintillation detector is commonly used in environmental gamma radiation detection, which converts gamma rays into photons and subsequent electrical pulses. The electrical pulses are then measured in counts and correlated with energy values. A common challenge in such measurements is to isolate desired signals from the background noise due to limitations of instrument resolution combined with the presence of background radiation and other complex systematic uncertainties. Therefore, reliable software approaches are needed to clean up the data and draw conclusions about the different peaks found in the spectrum.
This research aims to develop algorithms that can accurately obtain counts at certain energies from the NaI detectors. In general, the algorithms operate by calibrating the sensor via a two-point linear calibration using characteristic peaks found in background radiation, then isolating the peak by locally analyzing the derivative of the Counts/Energy curve at selected energies. Counts are obtained by reducing background noise from the resulting peak and integrating under a Gaussian fitted to the peak.
Procedure & Methodology
Data collected from the photon scintillation as signal pulses are binned into 1024 channels based on their respective strengths. Since the amount of scintillation is directly proportional to the energy deposited in the detector, the bins can be converted into energy values via calibration with known energy sources. In this project, the calibration is done using two peaks, namely the decay of Bi-214 at 609 keV and the decay of K-40 at 1461 keV. Both of these isotopes are naturally-occurring, with Bi-214 being a daughter isotope of Uranium and Radon and K-40 existing in almost all living things, making them prime candidates for sensor calibration.
To detect a peak, an algorithm is developed and applied across a large part of the dataset to find an estimation of its location. Then the precise peak is found by detecting a peak in the area around the first estimate. Figure 1 depicts the result of applying the peak detection algorithm to identify two characteristic peaks: K-40 at 1461 keV and Bi-214 at 609 keV. Using the location of these two peaks as well as their expected energies, a linear calibration function is created, as shown in Figure 2.

Fig 1: Result of peak detection algorithm

Fig 2: Calibrated energy spectrum
The next step is to isolate the peak at the energy at which the user wishes to obtain counts. For this project, a simple derivative function has been created, which returns the slope of the line connecting the points immediately before and after the point in question. The leftmost point (leading edge) of the peak is identified by the absolute derivative of the function falling below a certain threshold. The rightmost point (trailing edge) is the first point where the derivative at a certain point is 25% of the derivative five points to the left of it (since some peaks may not have a local minimum to the right). An example of peak isolation is illustrated in Figure 3.

Fig 3: Peak isolation at a certain energy (chosen by the user), and the estimated noise
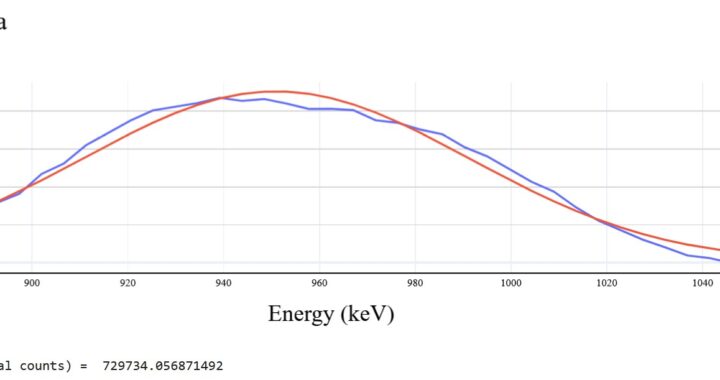
Between these two points, a straight line is drawn (note that the y-axis is log scaled). This line represents the background noise due to gammas not being fully absorbed by the scintillator, and thus should be subtracted from the data to obtain a noise free peak. To obtain counts from this peak, a Gaussian regression is performed on the curve and the area under the Gaussian curve is taken to be the total counts for that energy, as shown in Figure 4.

Fig 4: Drawing of the isolated Gaussian, the Gaussian curve, and the area under it
Conclusion & Future Research
In this research project, a series of novel algorithms are developed for gamma spectra peak detection, energy calibration, peak isolation, and energy calculation. This provides preliminary methods to deduct noise from NaI scintillation detector data and obtain meaningful measurement values. This is ongoing work. A few areas of enhancement will be researched and implemented in the next phase:
- Better handling of sufficiently noisy data in the derivative method, where there are many small local minima and maxima. Attempts have been made to increase the distance between the two points that the derivative function uses to 5 before and 5 after, but a better approach may be taking an average derivative of a few points instead of just one. Note, however, that the peak detection function works fairly well for noisy data.
- Better detection of the leading edge of relatively flat peaks. A possible approach may be making the threshold stricter for detecting the local minimum.
- Implementing checks to see if the noise function (the straight line from the leading to trailing edge) is downward sloping.
- Improving calibration accuracy by using a three-point (possibly polynomial) calibration restricting the function to pass through the origin. This can prevent negative energy values at low bin numbers with a two-point calibration, if the y-intercept of the calibration is negative.
- Improving count accuracy by calculating the integral with narrower bounds of integration, possibly using the Gaussian error function, rather than using the area under the Gaussian curve from negative infinity to positive infinity.
Acknowledgements
I would like to thank Dr. Ali Hanks at UC Berkeley Department of Nuclear Engineering for providing this research opportunity and her guidance throughout the project, as well as Dani Solakian for helping review the article.


