
Data Acquisition
For my project at least, the data acquisition wasn’t the smoothest, but it ended up working. Of course, because I am studying the relationship between rainfall and radon levels, I would need to find precipitation data and the radiation data for the same location. As we already had the radiation data[1], I needed to find a resource that would also give me data for rainfall. I ended up using the data from the National Climatic Data Center[1], which is a government resource provided for everyone to use. So the way I went about doing this is at first finding a location where there was ample radiation data collected over at least a year, and see if there were any government weather sensors located around the location where the DoseNet sensors were. At first, I was looking at the general cpm data collected in the UC Berkeley Locations, but soon I moved to Pinewood School Outside as the data there was more accurate. Another driving factor in this switch was that the sensor was outside, which would give me a more accurate representation of what was actually happening in the air. Luckily, there were a few government weather sensors close to the Pinewood School, so I could use this location without too much problems. The dates I looked at started February 2018 and ended in April 2019, giving us a little more than a year’s worth of data.
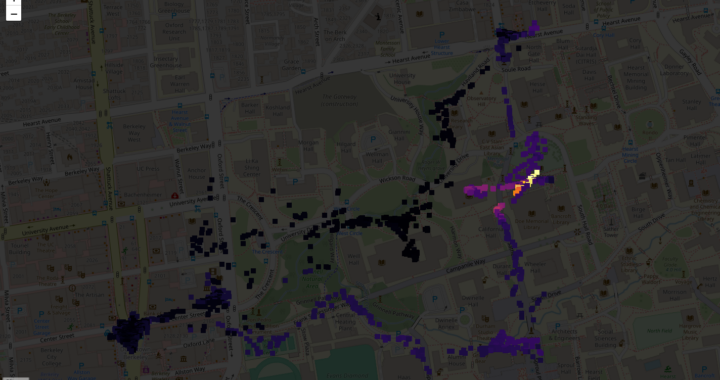
At first, I wasn’t sure where to start my project, so I made a google map in which I put the locations of all of the DoseNet sensors and the dates where cpm data was collected. Then, I started to analyze Berkeley radiation data in comparison to rain. However, there didn’t seem to be much of a correlation, and the same applied to some of the other locations I looked at as well. It was here that I got the suggestion to work with Pinewood Outside D3S data, as it was probably better to use and more accurate. From here on some research had to be done. After looking at a couple, I decided to follow a research paper that had already detailed the relationship between rain and radiation[1].
Raw data of rainfall with dates and cpm (radiation counts per minute)
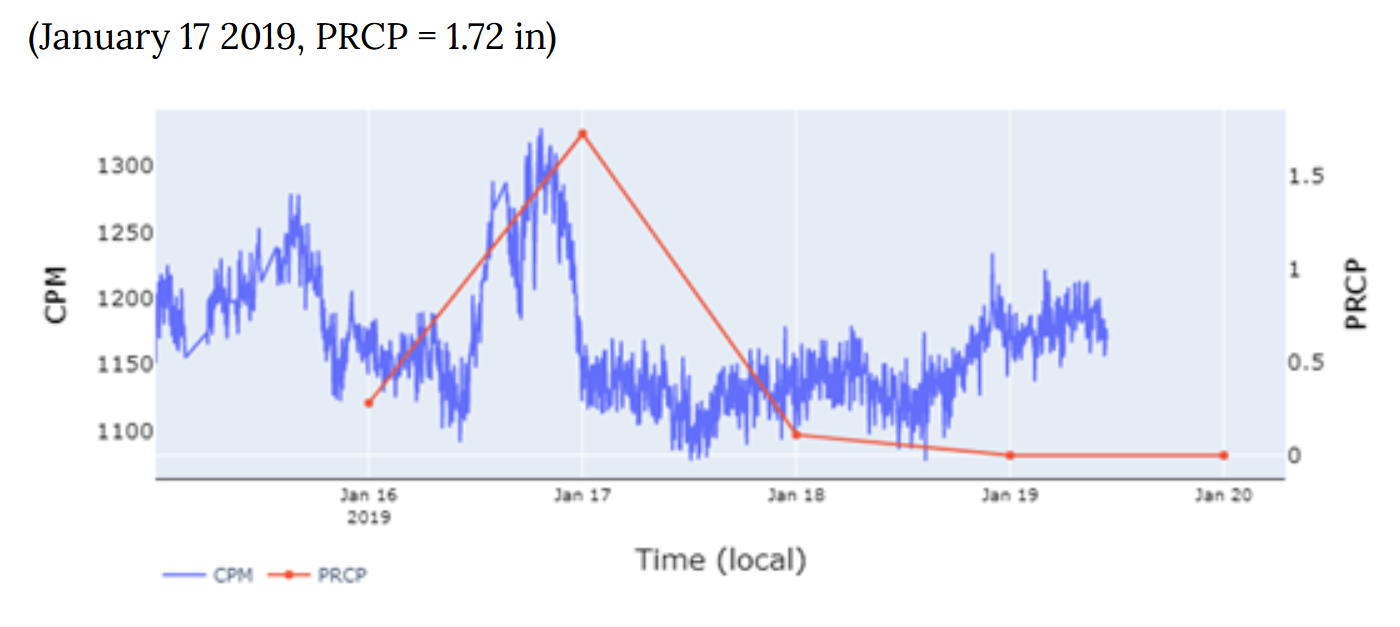
From this I learned that whenever there was a rain event I could expect to see a sudden spike in the radiation data. This would be caused by the radon decay products in the atmosphere caught by the rain then brought to the ground. Then we would expect to see the cpm in the air exponentially decrease as the radon products would decay. So my next steps were to put the Pinewood Outside rainfall data and cpm data side by side and zoom in on certain days where there was rainfall. After that was done, I could work on analyzing what was really going on during the rain periods. I ended up switching to using Desmos as a plotting tool because the python code got a bit complicated, but for now Desmos does work a little in helping me find statistical data, although the work is a bit manual. All the code I wrote would be on Cocalc and Github and I will comment on it nicely so people can read and understand it.
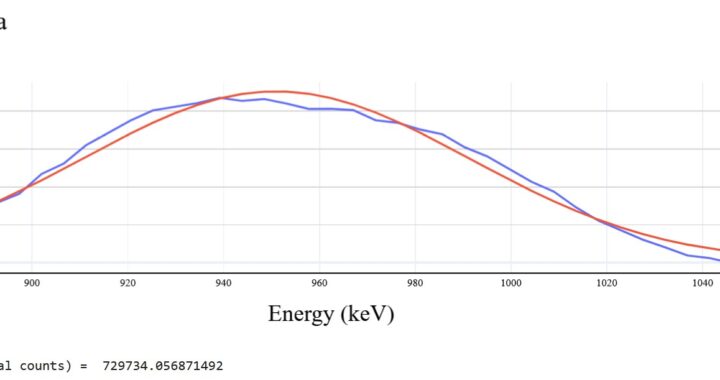
I think the key results from my work is that I was able to find a consistent pattern between how the cpm changed when there was a rainfall event at a certain date. I was able to find significant spikes in cpm during days of rainfall and an exponential decrease shortly thereafter. I’ll include a few simple examples of cpm whenever there was a rainfall event, so you can see the exponential curve and fitting.
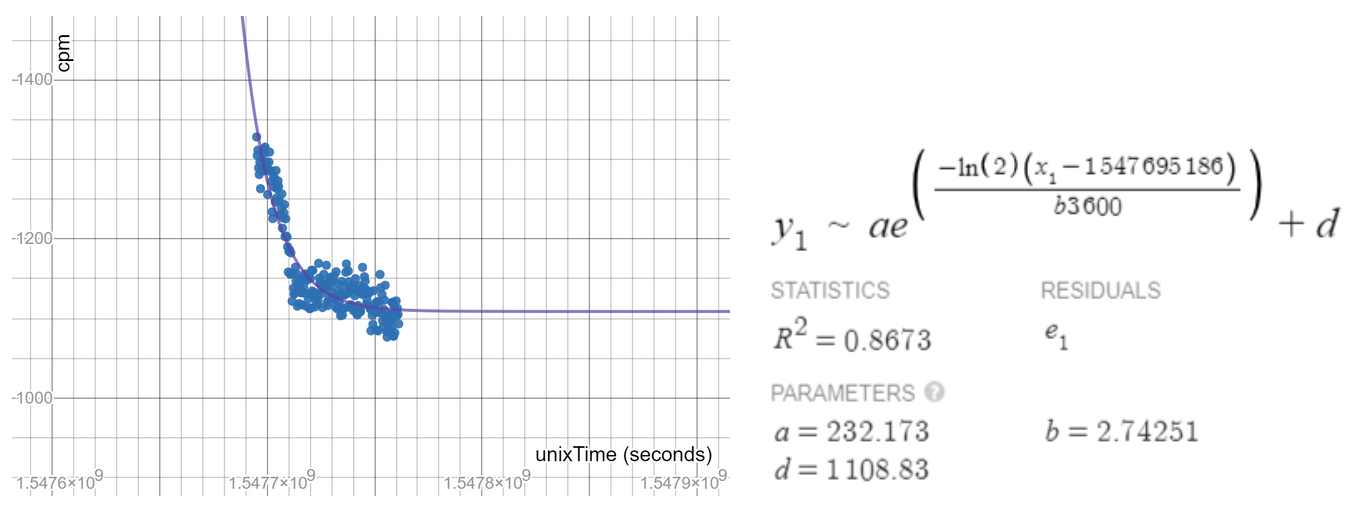
Cpm spiking and decaying after rainfall
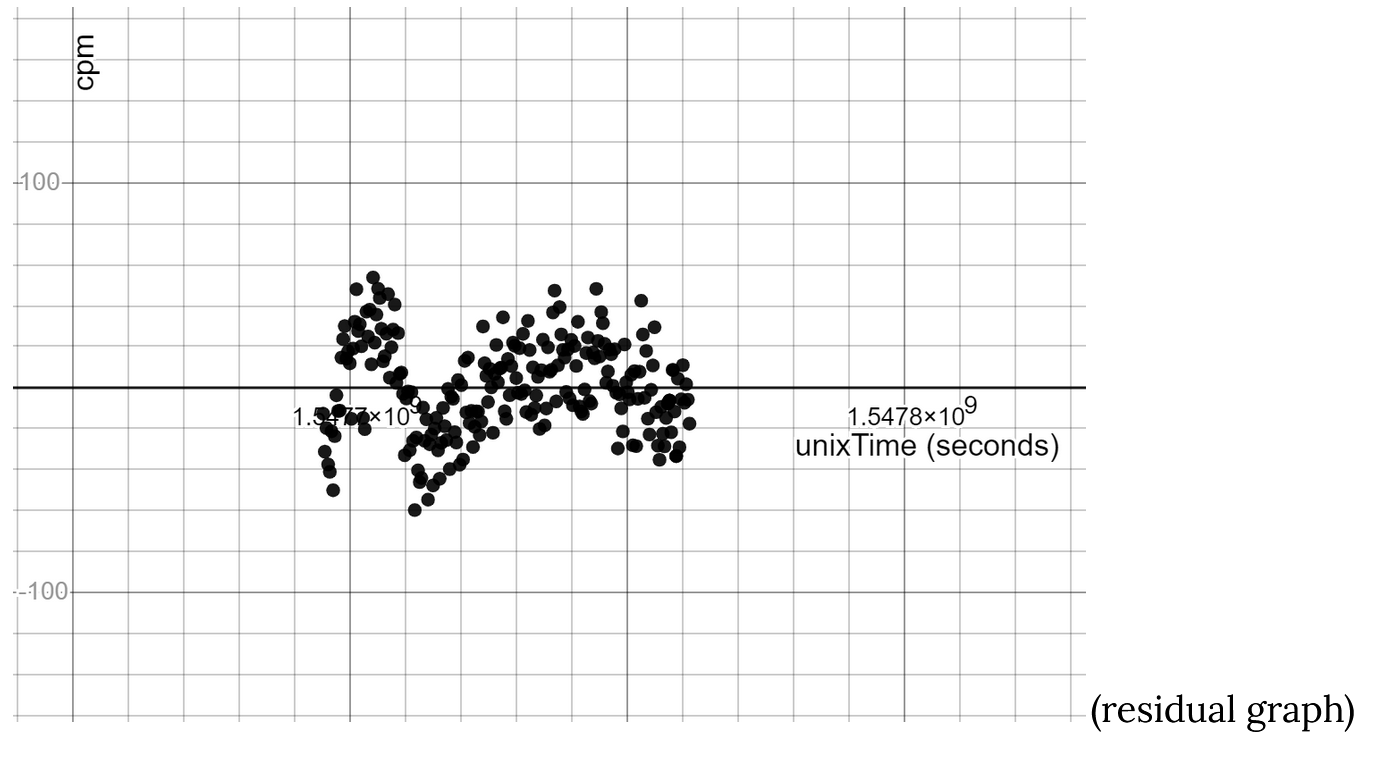
Residual cpm following decay (from left graph)
Interestingly enough, the b values for all the graphs were not the most similar, although if the rain brings down the same radioactive material from the atmosphere the b value should stay consistent throughout. I have a few theories about why this is, such as the way I collected the data might not have been consistent throughout or because of multiple rain events in a short amount of time. But here is the graph of the amount of rain in a certain day vs the resulting b value of the exponential decrease.
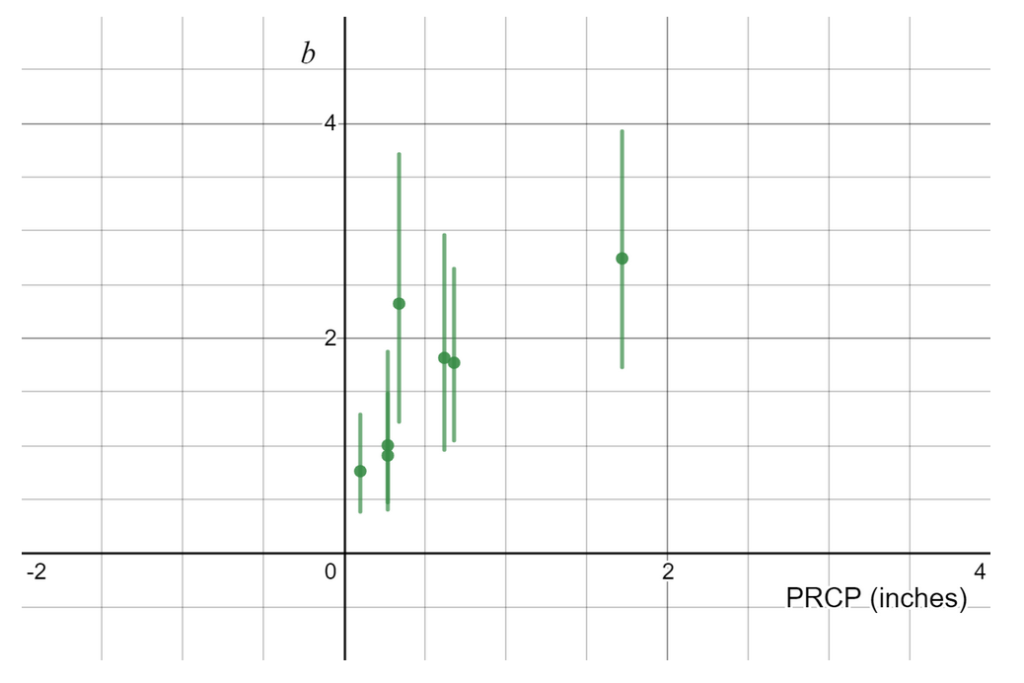
precipitation vs b-parameter
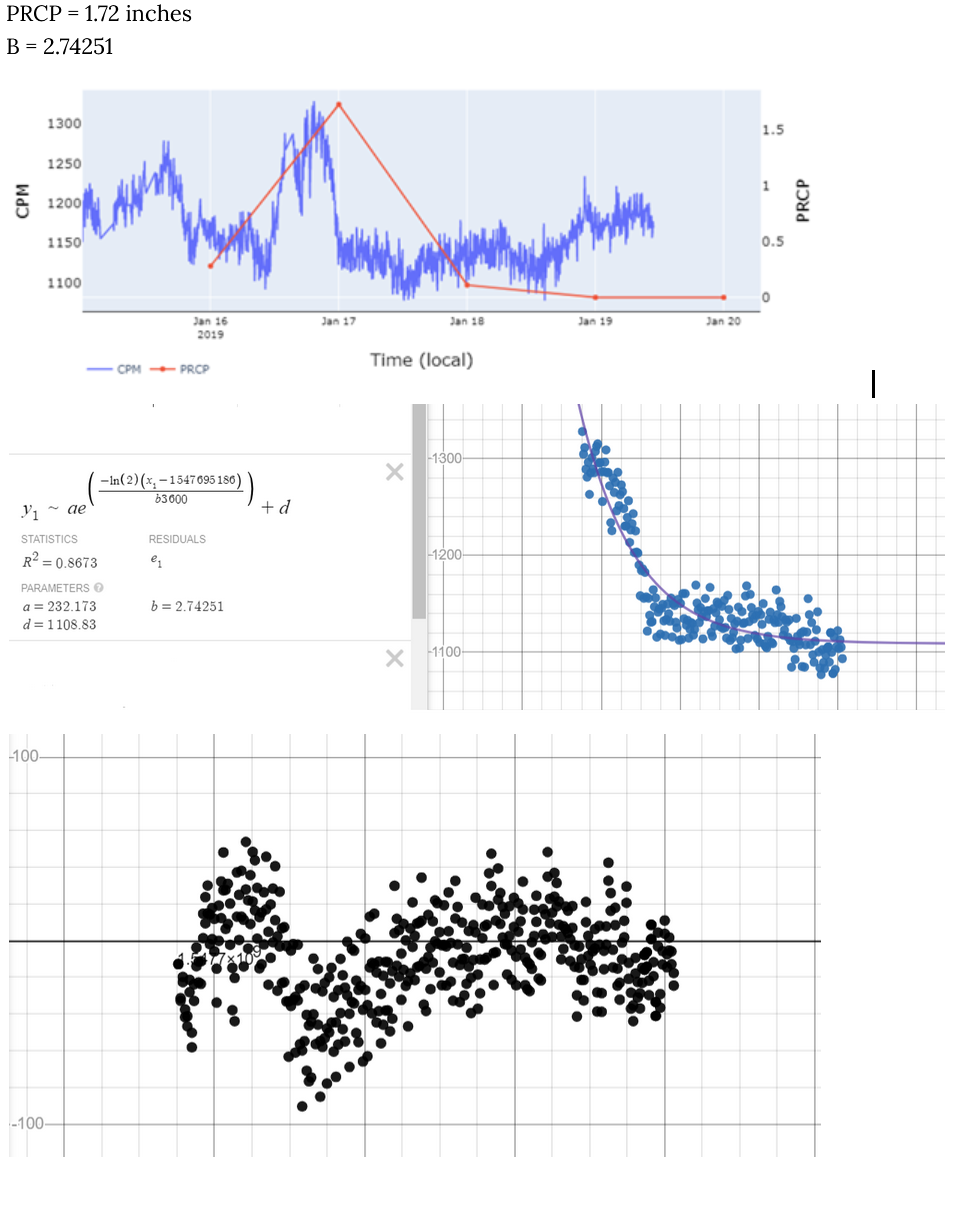
Further visualizations: January 17 2019
Dec 17, 2018