Introduction
My work for the 2022 summer semester consisted of analyzing the accuracy of DoseNet’s sensors with comparisons to nearby sensors on the WeatherUnderground network. Accuracy and correlations were the main themes of my project, using linear regression models and t-tests to measure correlations between datasets.
Data Acquisition
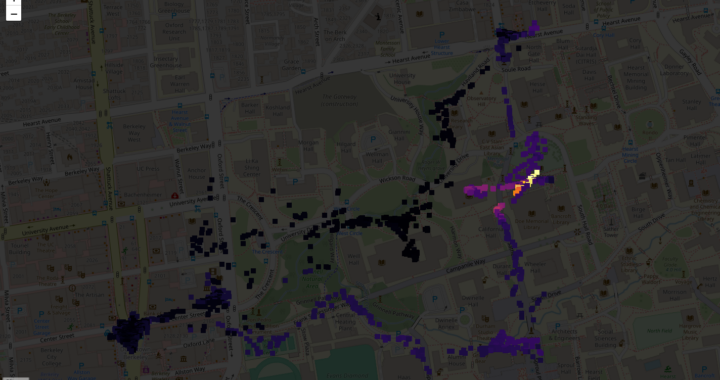
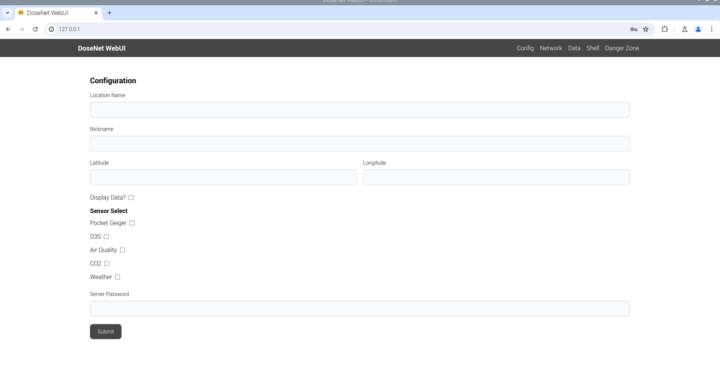
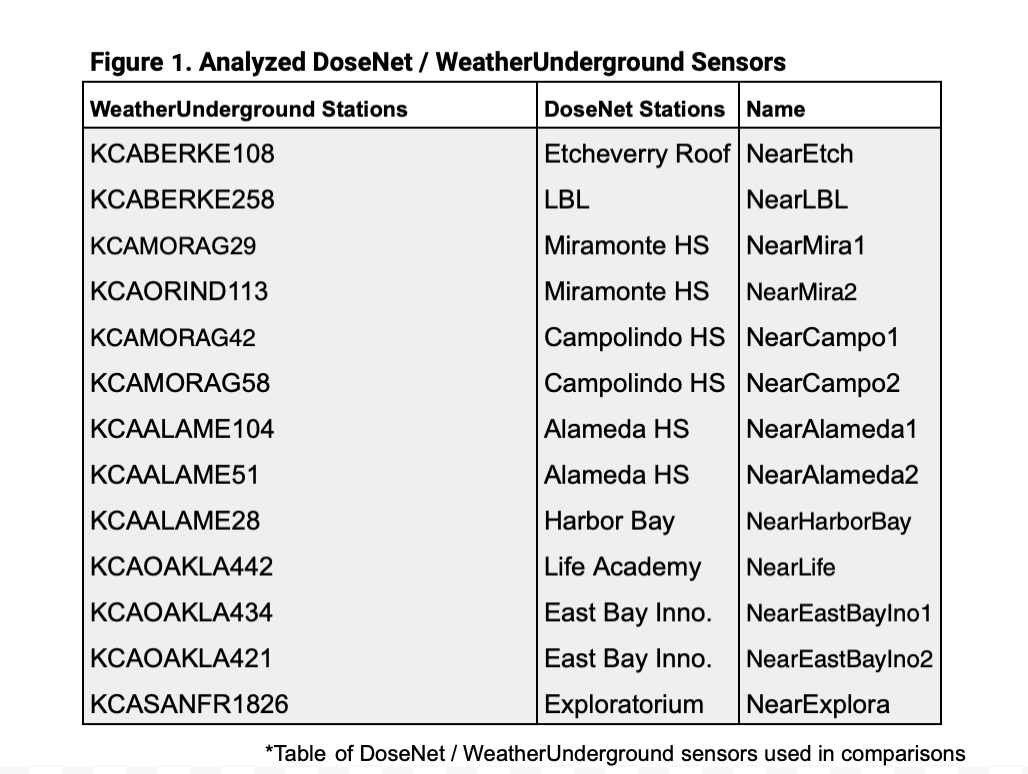
Weather data was sourced from various DoseNet sensors (Figure 1), paired with nearby sensors on WeatherUnderground’s network (weatherunderground.com). Due to long element load times on the website, Selenium webdriver’s were used to extract the element containing the weather data. The data was then saved into an html file that was reformatted into a Pandas DataFrame through the read_html method. Using Pandas’ built in str.replace, .astype, and .rename, I was able to clear the DataFrame of typographical symbols. This data was ready to be put into a linear regression model and used in calculations.
DoseNet sensors (i.e. Etcheverry Roof) gather data at five minute intervals, often deviating 1-2 minutes from WeatherUnderground’s readings. This was often acceptable for simple tasks such as comparing readings for temperature between the two sensors. For more complex tasks (i.e. comparing precipitation or Csl data) it was necessary to have well-formatted data. Binning the data using Pandas resampling (for our analysis, we used 5 minutes) allowed for equal time distributions which fulfilled this requirement.
Analysis and Results
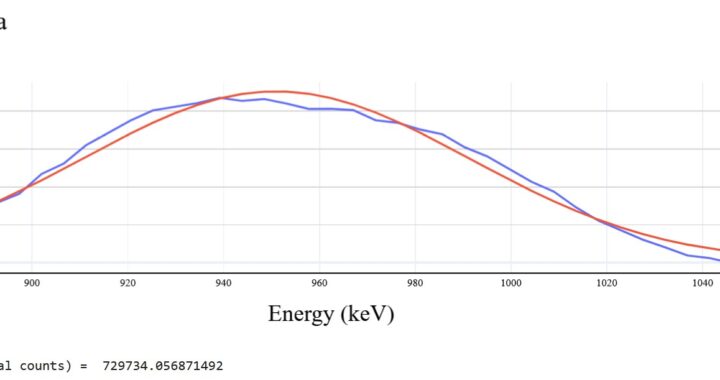
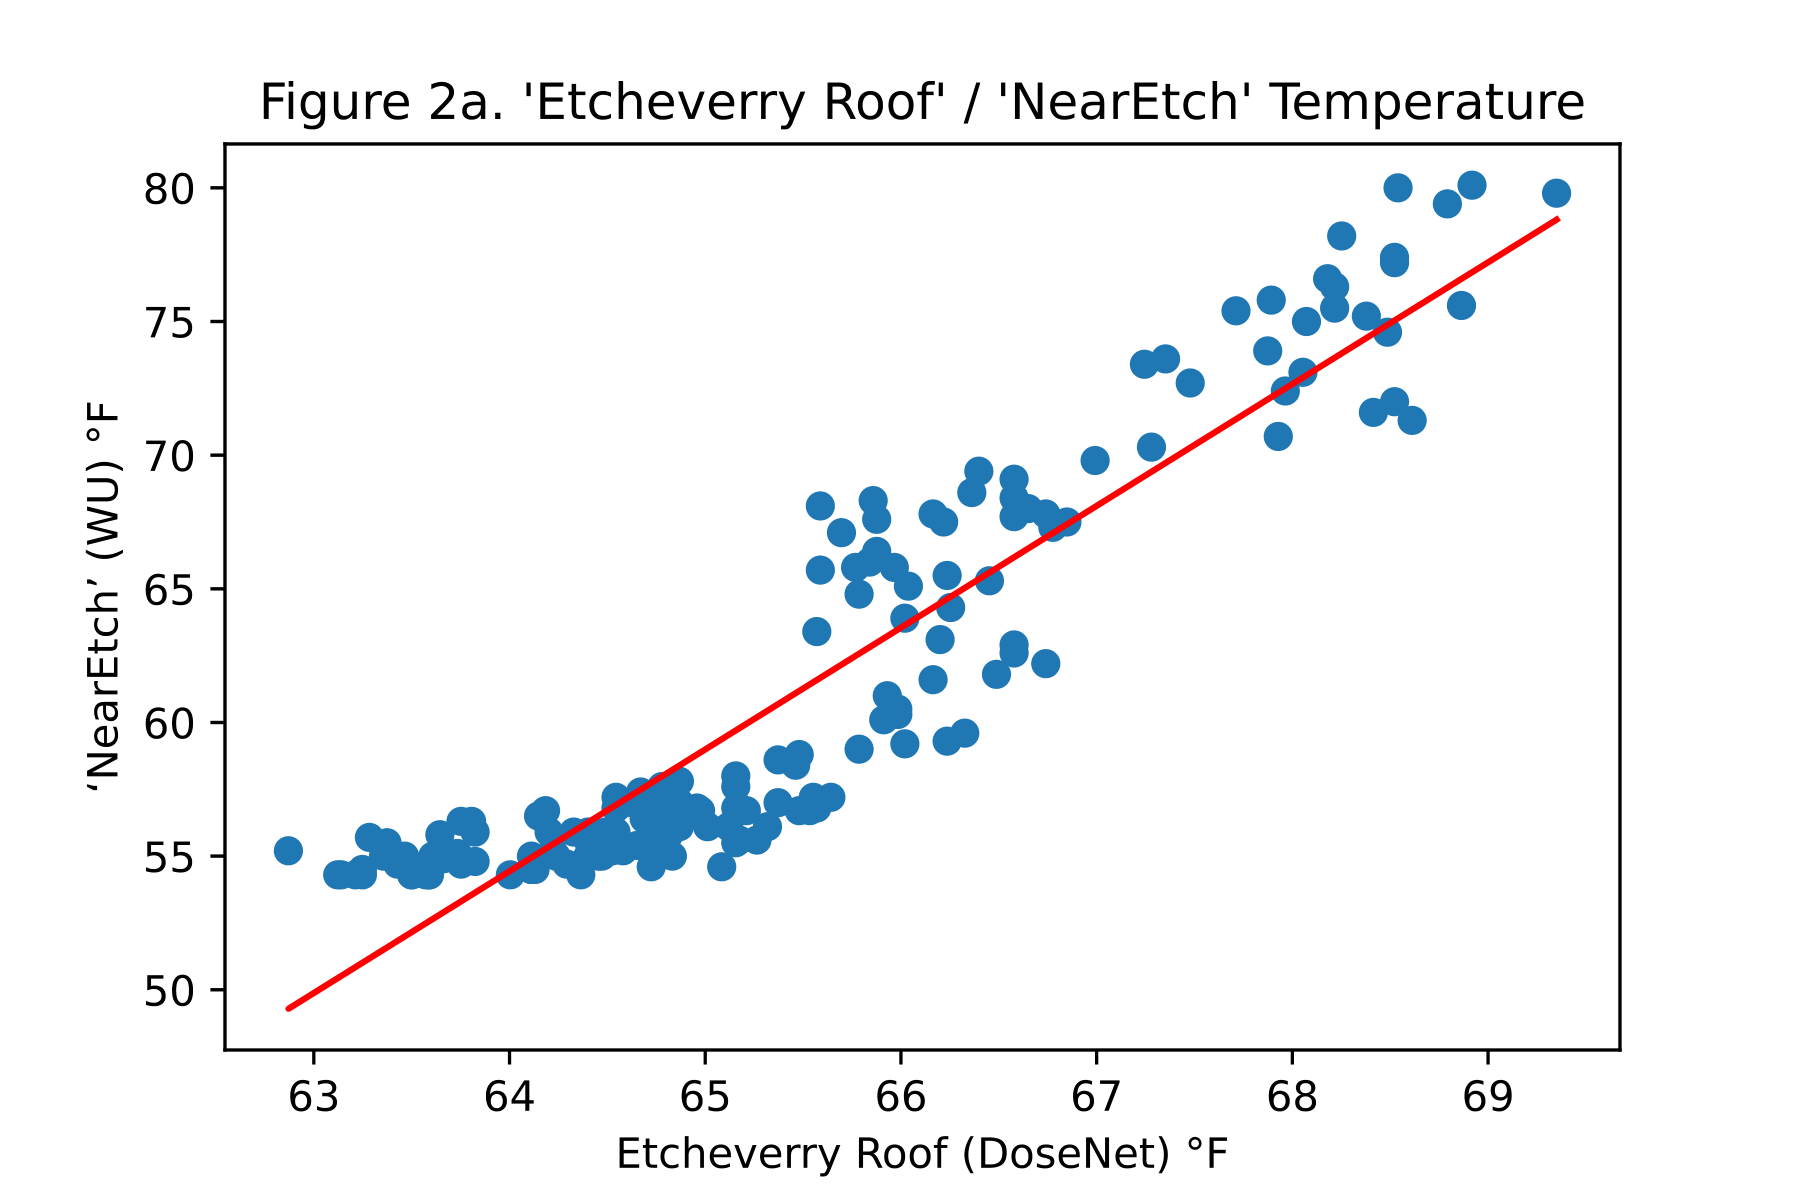
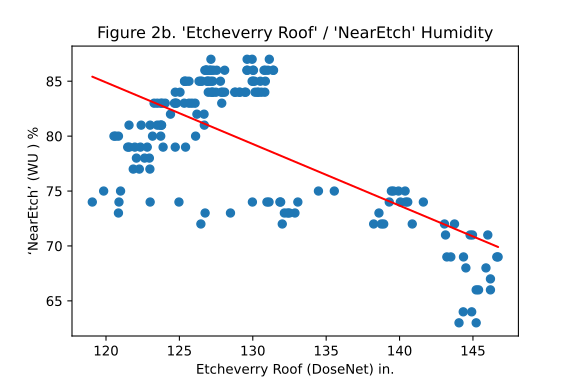
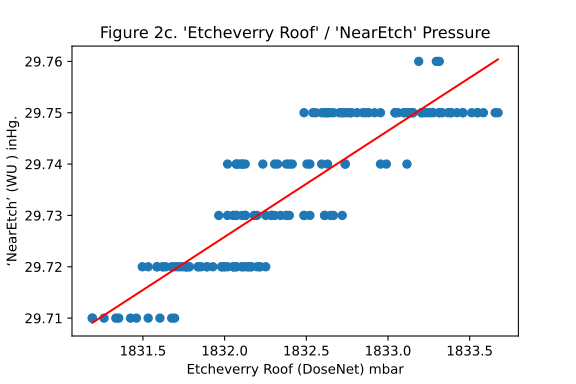
To analyze the data gathered, I had to determine the best statistical measures for the limited information available and the distinct groups of data. For the purpose of extracting correlations, I found a linear regression model to work best. Paired with a t-test, I would have a good idea of the relative correlation between any two compared variables. My experiments started with the comparison readings between the ‘Etcheverry Roof’ and ‘NearEtch’ temperature sensors (Figure 1). When displaying the data sets in a linear regression model using Sci-Kit Learn’s LinearRegressor function, it was apparent that there was a slight variation between the two datasets (Figure 2a). The t-test result, ‘T-value’, indicated that there was no statistically significant difference between the datasets (Figure 3, Figure 4), further supporting that there are only slight variations between the measurements. Similar results were seen for humidity and pressure measurements (Figure 2b, Figure 2c).
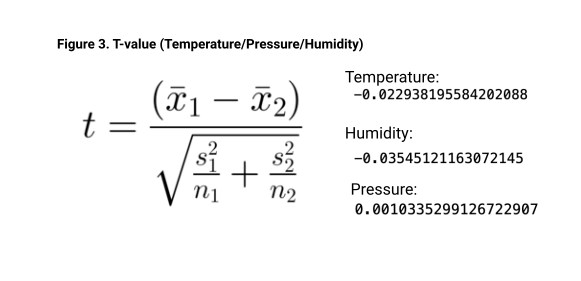
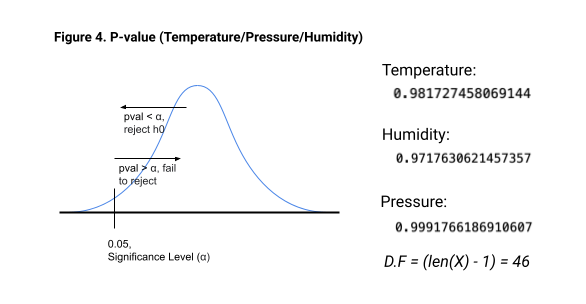
With the null hypothesis as ‘no difference’, the calculated p-values (Figure 4), all significantly higher than 0.05, indicate a very strong correlation between the DoseNet and WeatherUnderground temperature/humidity/pressure sensors.
It is reasonable to assume any variations found could, in part, be due to differences in sensor conditions. These results were reflected in the rest of the sensor comparisons.
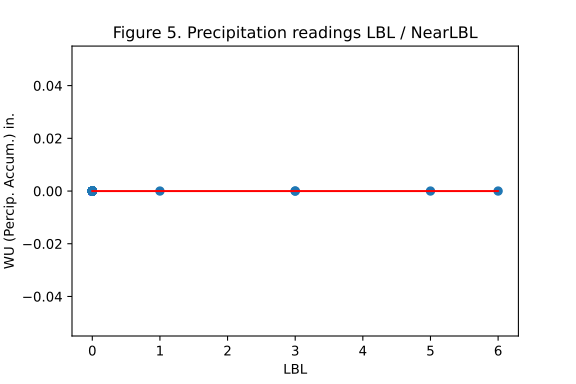
Using this template, I tackled unusual readings from precipitation (Decrisp) sensors at LBL. The sensor, working on a scale of 0-10, reported readings with no clear source. Initially, I compared the precipitation readings to precipitation data from WeatherUnderground, but no clear variation in the data was found. Any spikes were drowned out by ‘zero’ readings (Figure 5). No t-value or p-value was taken into consideration due to the overwhelming amount of equivalent ‘zero’ data (this indication of correlation would not be helpful.) Similar was found when comparing raw data, as WeatherUnderground’s sensors reported no accumulation of precipitation.
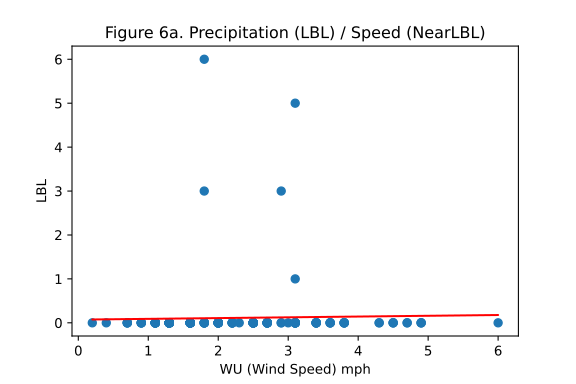
However, raw data indicated some similar spikes in wind speed data from WeatherUnderground to the perception readings. (Figure 6a) Although, plotting the data did not show any direct correlation, and t-values (Figure 6b) must be looked at with skepticism, as their only purpose here is to quantify slight departure from expected values
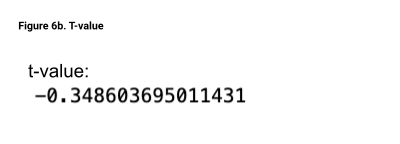
While there is no conclusive statement for the precipitation phenomenon, it’s safe to say that it is not correlated with rain readings from other nearby sensors.
Conclusion
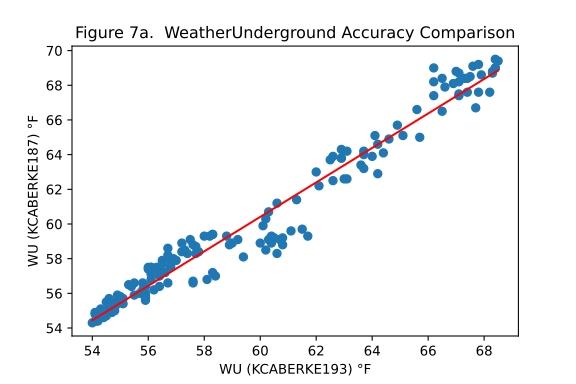
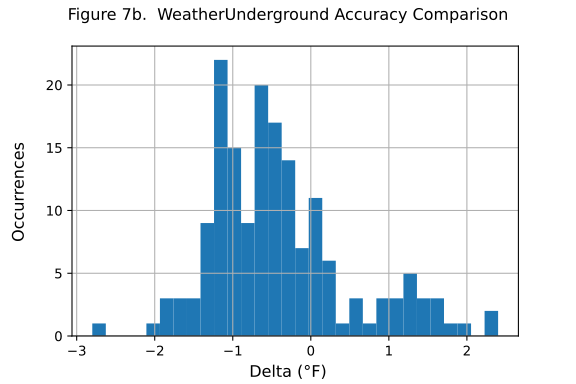
Through the statistically significant correlation between the Temperature/Humidity/Pressure sensors of the DoseNet and WeatherUnderground sensors, we can conclude that they’re highly accurate. As we found, the p-value was nearly 1, and the t-value was nearly 0, both supporting the strong correlation. From earlier tests (Figure 7a, Figure 7b) for accuracy between WeatherUnderground stations situated about a block away from each other, slight variations were expected.
While I was unable to find any definitive correlations between the various sensor readings from WeatherUnderground and LBL’s precipitation, it was made clear that the slight variations were not due to any precipitation.
*Featured Stock image from RBGStock.com