March 11, 2011
A 9.0 earthquake in the Pacific Ocean sent a massive tsunami to the coast of Japan. Upon landbreak, seawater came awash and forced regional emergency evacuations. Flooding, particularly in Fukushima prefecture, proved to have drastic additional consequences. Water over the walls of the Fukushima-Daiichi nuclear plant short circuited control systems and led to a triple reactor meltdown, releasing radioisotopes into the water that spilled into the surrounding region, deposited in the land and sea. A decade of deliberation and investigation over the events and their long lasting consequences remains underway, fueled by concerns about public health impacts and the action necessary to address preventable failures like TEPCO’s Fukushima plant in the future.
The casualties from the tsunami and difficulties evacuating resulted in nearly 16,000 deaths alone, but the coming ramifications would go beyond the flooding waters(1). Following the meltdown, unevacuated Japanese residents continued to live within a 20-30 km radius of the meltdown for up to a month. Later, this region was deemed too dangerous to stay in overnight. The Japanese government began zoning evacuations as many struggled to deal with the earthquake and tsunami, unaware “that the wind and the rain on March 15th brought radioactive particles” from the plant’s explosion(2). Tokyo Electric Power Company (TEPCO)’s failure to prevent a meltdown exacerbated an already tragic natural disaster, introducing additional health and environmental impacts atop the unprecedented housing displacement in the hundreds of thousands from flooding and nuclear evacuation zoning(3).
Measurements were taken throughout the region to inform government evacuation policy. Concerns were raised by residents, many who have by now moved back to their homes in dezoned regions. A study found that many points measured “to be above 1 millisievert per year (mSv/yr)” where residents had already returned(4). The Japanese government’s zoning requires a background dose rate of 20 mSv/yr to be designated as a nuclear evacuation zone, the same as radiation workers’ occupational limits, while the international standard for the upper limit of radiation exposure to the public is 1 millisievert per year(5). The government has lifted evacuation orders on regions as radiation levels have decreased with time, though their attitude about transparency and disclosure has left many of the affected unwilling to possibly risk their health to return home as thousands remain in temporary shelters.
Measurements for the Masses
This communicatory disconnect demands scientists to mediate and inform both the government and its citizens towards a remediary road. Government concerns surrounding full transparency could be motivated to reduce panic and concern, but do more to leave much of the preventable radiation impacts, and their origins, up to public question. Labs across the world congregated their focus to monitoring radiation levels in and around Fukushima, sending scientists to collect and evaluate samples in a global response to the disasters. Collaborative efforts were organized internationally between the labs by the International Atomic Energy Agency (IAEA). The Japanese government sent their own scientists to monitor the collection and evaluate the data thoroughly, made publicly available by the IAEA(6). The report containing the interlaboratory comparisons (ILC) and proficiency tests regarding the levels of radiation is 50 pages long. The Marine Monitoring: Confidence Building and Data Quality Assurance Project has compiled visualizations of the statistically significant decay of the concentration of radioisotopes in various samples taken around Fukushima from 2014-2016. Location data, the cross referencing statistical methods to validate data from the 6 international labs, and the litany of scientists and their various methods and detectors are broken down in the report as well(7).
Tritium Levels around Fukushima

September 2014 Tritium levels for seawater samples
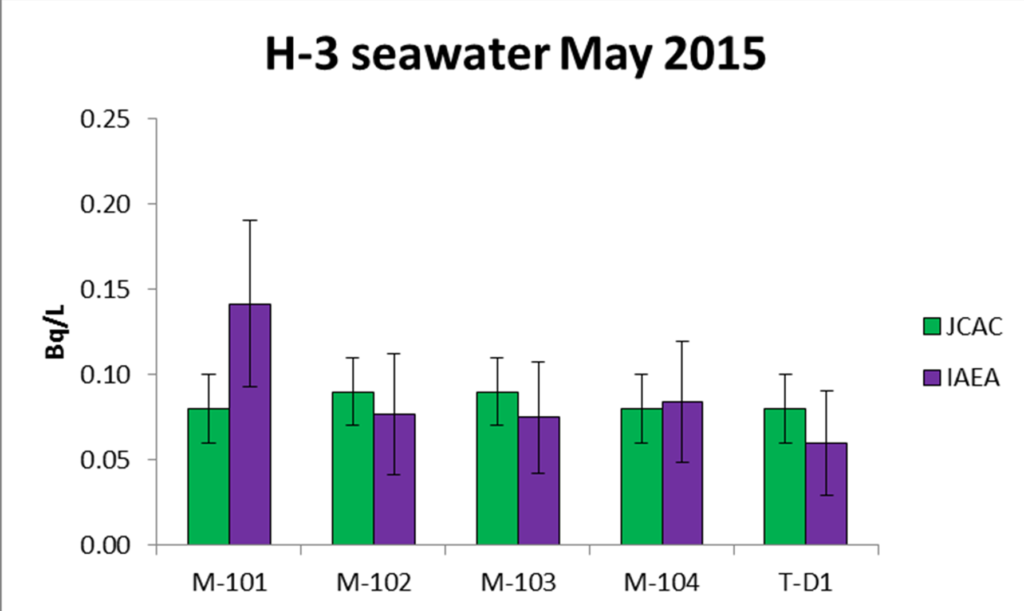
May 2015 Tritium levels for seawater samples
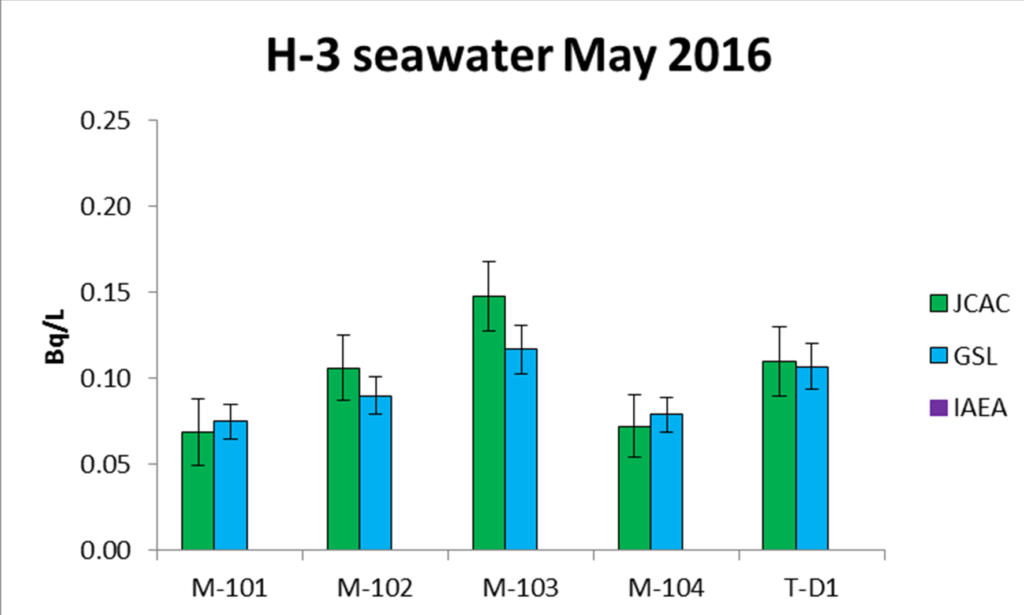
May 2016 Tritium levels for seawater samples
Tritium (H-3) concentrations in seawater from 2014-2016 decreased from an average of about .15 Bq/L, to about .08 Bq/L.
Strontium-90 Levels

September 2014 Strontium-90 activity in seawater samples
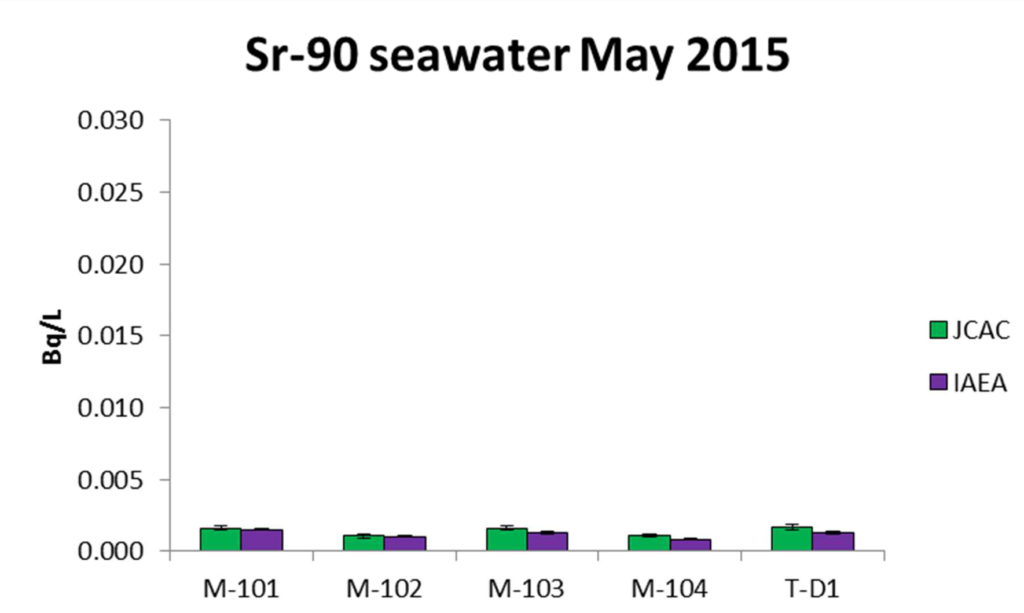
May 2015 Sr-90 activity in seawater samples
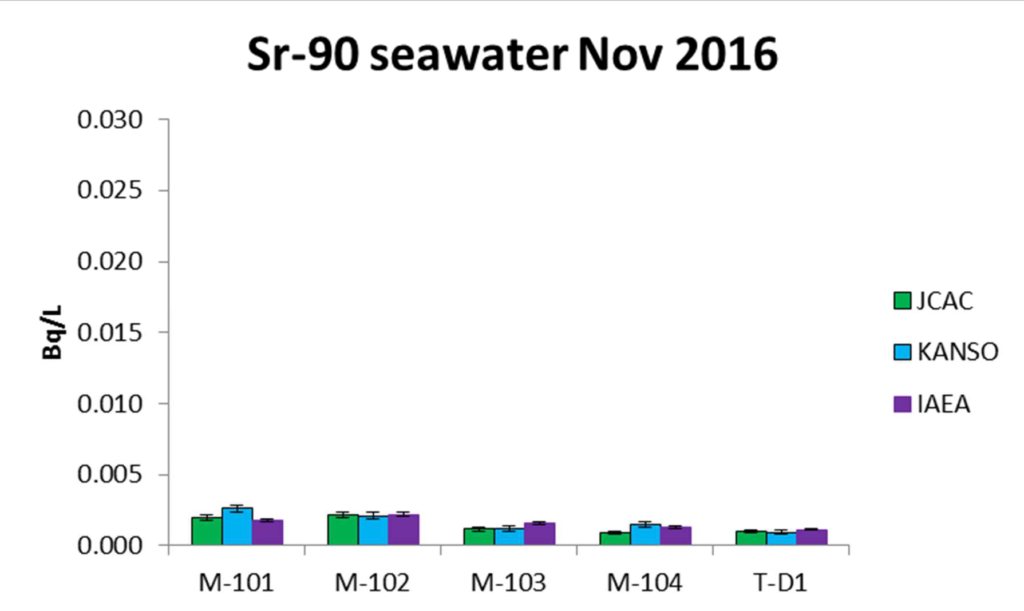
November 2016 Strontium-90 activity in seawater samples
Strontium-90 concentrations in seawater from 2014-2016 decreased from a sample reporting .25 Bq/L, to samples averaging less than .005 Bq/L.
Cesium-134 Levels

September 2014 Cesium-134 activity in seawater samples
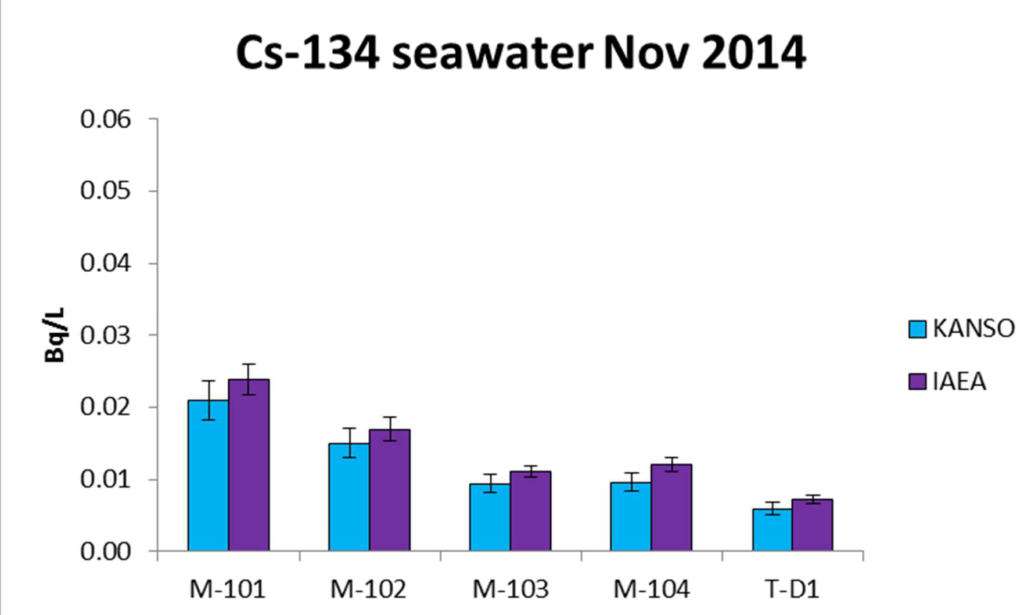
November 2014 Cs-134 activity in seawater samples
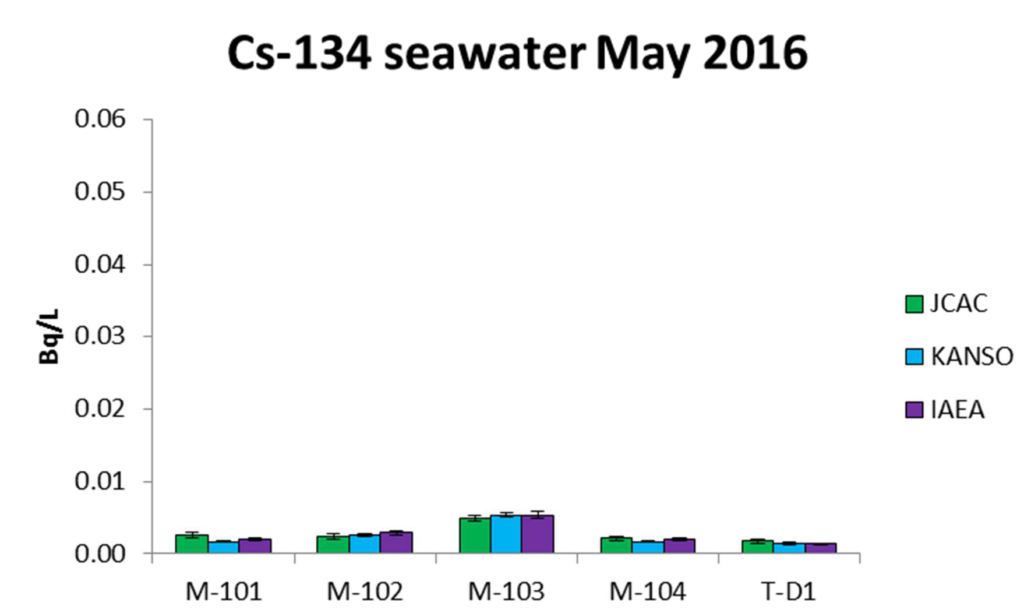
May 2016 Cs-134 activity in seawater samples
Cesium-134 followed the decay trend in seawater samples in the same time frame.
Sediment samples held on to Plutonium-239, 240, and Cs 134 longer than seawater samples, and some areas sampled held significantly higher concentrations of radioisotopes than others. The exact locations and further visualizations of the sampling are marked in the report. Health impacts depend on the kind of radioactive decay as well as its activity and exposure, ingestion of high activity high energy beta emitters (Sr-90) poses a much greater risk than background exposure to short lived high activity gamma emitters (Cs-134).
Cesium 137 has remained present since nuclear weapons testing and the Chernobyl plant’s meltdown and saw elevated levels following the Fukushima reactor meltdown(8).
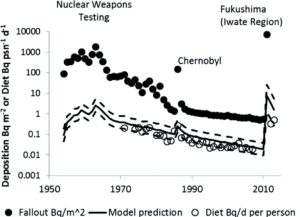
Presence of Cs-137 beyond radioactive spilling at Fukushima
These samples’ activity is presented in Becquerels by weight or volume, and the labels on the bottom axis are location markers and each bar represents a different lab’s analysis of the sample. They were collected locally and sent to labs to be analyzed by various detectors and methodologies to provide a diverse array of data to be compared in the ILCs. A 1 Becquerel (Bq) activity means there is 1 radioactive decay per second, a standard unit for measuring radioactivity. Measurements in Bq/kg or Bq/L allows determination of the activity in any amount of the irradiated material. The correlated Sieverts unit is used to measure the dose absorbed from a particular radiation exposure. The irradiated contaminants in soil and water made their way up the food chain through spread in air and sea, with measurable radioactive deposits across the Pacifc ocean.
Across the Pacific
Health concerns about radiation spreading from Fukushima to the West Coast of the US prompted local action to assess and communicate the real risk. Airborne radioactive particles made their way into the water supply from the air, absorbed by grass eaten by cows which passed into the food supply. Later, marine life contamination would also be taken into consideration through the initiative of KelpWatch. The multifaceted environmental analysis and public communication effort would evolve into UC Berkeley Radwatch, employing the use of an existing radiation lab to create an accessible source for radiation data. Now under the direction of Dr. Ali Hanks, students help to create an expanding suite of radiation and environmental detection systems. The collected data undergoes analysis before being posted to the Radwatch website.
Elevated levels of radioisotopes from Fukushima were found in the Radwatch analysis of the data collected from West Coast rain water, milk, and air samples taken following the meltdown. The decay of radioistopes can be observed in the data visualizations. The contamination could spread in many modes with a variety of re-uptake into the measurable samples, quickest through air travel, then rain, and a later presence in milk.
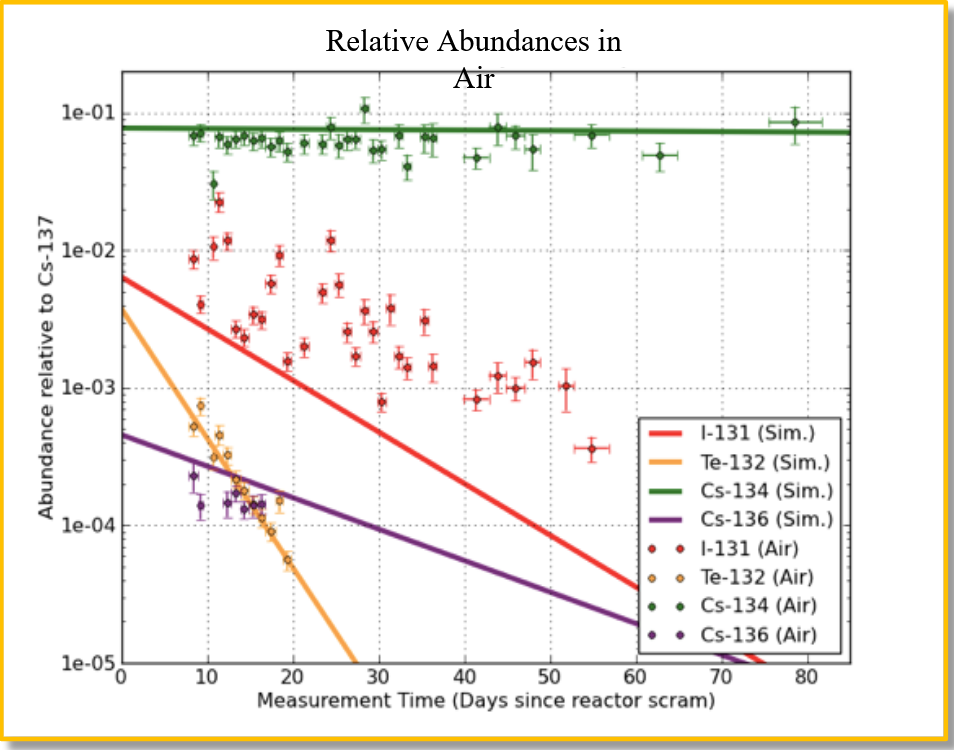
Increased levels of radioisotopes from Fukushima following scram (emergency reactor shutdown), levels decrease as isotopes decay.
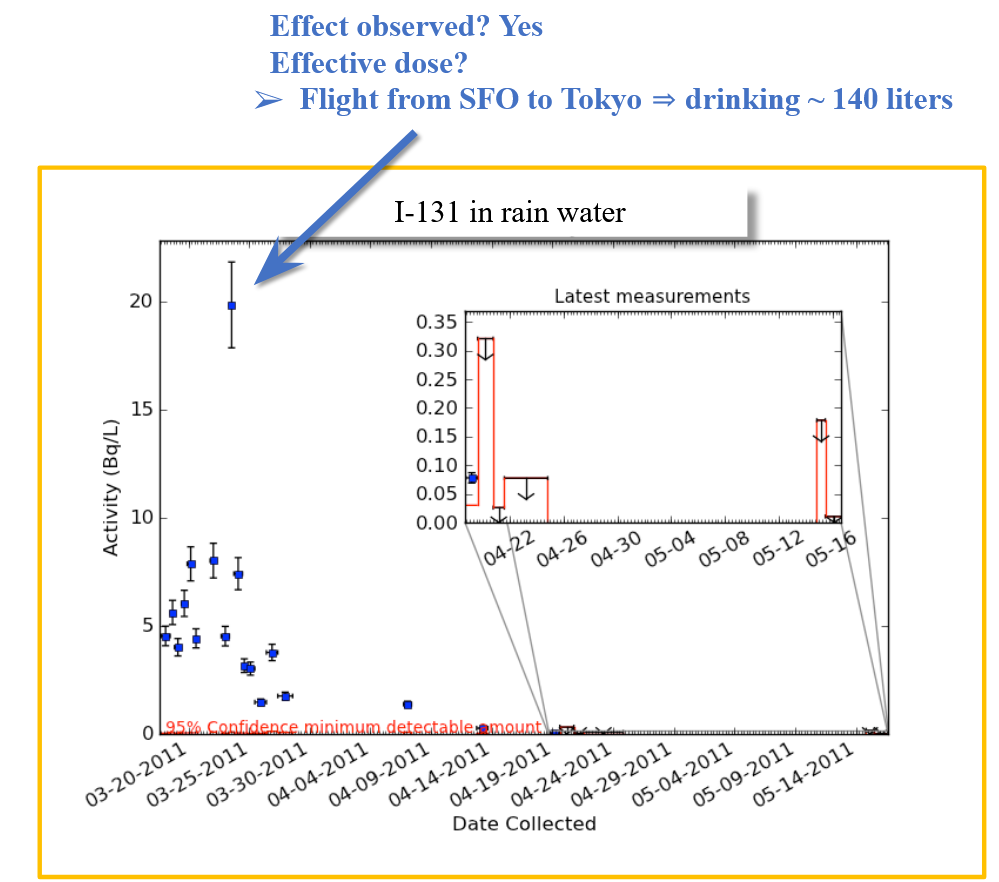
Iodine-131 binds to the thyroid and can lead to cancer, increased levels in rain following Fukushima meltdown. Levels had a detectable increase without much more risk
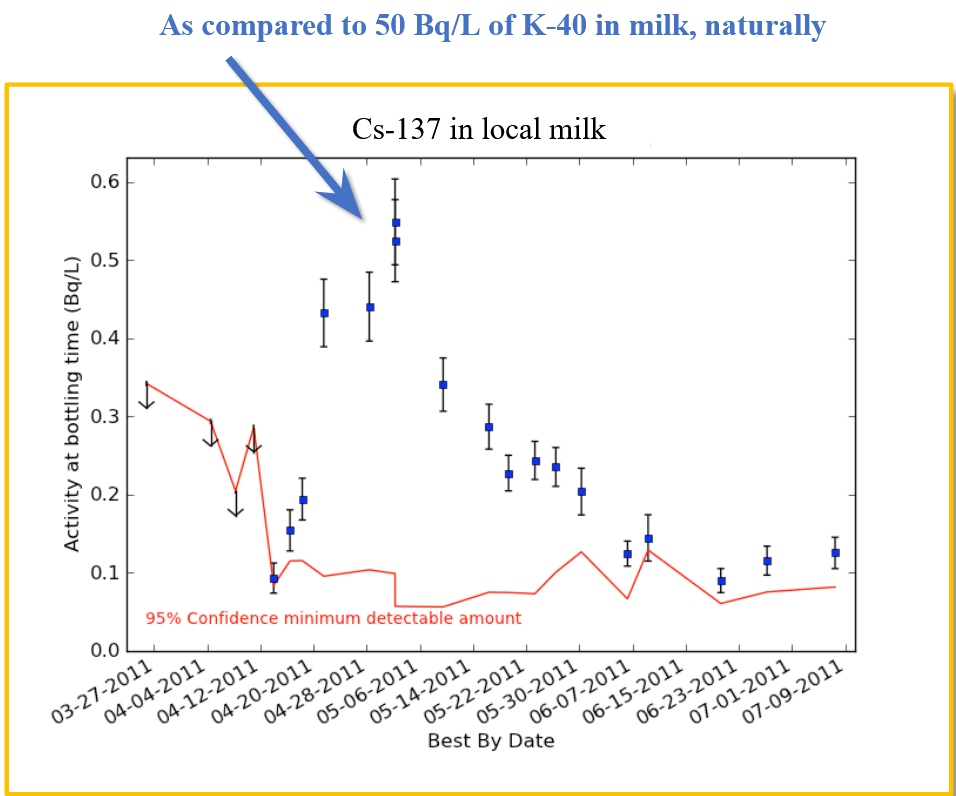
Increased cesium-137 levels in milk in the Bay Area, small increase in activity relative to natural presence of radioactive Potassium-40
Costly Learning Opportunity or Preventable Tragedy?
Scientists have collaborated from across the globe providing risk assessment based on a decade of data collected from Fukushima, the Japanese countryside, to all the way across the Pacific ocean. High levels of radiation leave the immediate regions around the epicenter of the meltdown as mandated evacuation zones, though whether too early or not, people are gradually being allowed back home. Supplemented with government aid and a litany of consolation payments from TEPCO following extensive and ongoing civil suits, the extent of the harm may yet show face in latent health effects from elevated radiation exposure(9). Despite the lasting effects from Fukushima, a reactor, hit harder by the earthquake and a taller wave of the tsunami, shut down safely and is scheduled to restart operation in Onagawa, only 123 km (76 miles) away from the epicenter of the 2011 earthquake.
A separate company, Tohoku Electric, built and operated the plant in Onagawa with more stringent and thorough safety precautions, now cutting no corners at risk of the locals’ health as TEPCO had done for their Fukushima-Daiichi reactor. Tohoku Electric expects to pay “about 340 billion yen ($3.08 billion) in total on the anti-disaster measures” to safely provide essential green energy(10). The cost to TEPCO in response to the radioactive contamination and housing displacement may see no end in its increase. Civil suits seeking compensation from TEPCO have payouts in hundreds of millions of yen for evacuees and those possibly risking their health in dezoned regions with elevated exposure. The preventable cost of the evacuations could have been prevented had it not been for TEPCO’s cost efficient safety measures, like a lower sea wall surrounding the already lower elevation reactor in a region historically impacted by tsunamis(11).
Takeaways for the next Decade…
The extensive radiation data that became available as a result of a preventable disaster comes with a massive cost to the credibility of the nuclear power industry, shaking trust in its safety even if health effects are kept minimal or never arise from those impacted by Fukushima. Another decade can reveal what more there is to be learned, and if the past and present lessons will be taken into consideration as the need for an alternative baseline energy source increases.
References
- “Great East Japan Earthquake.” World Health Organization, World Health Organization, www.who.int/westernpacific/emergencies/great-east-japan-earthquake.
- “Evacuation Orders and Restricted Areas.” Fukushima on the Globe, 31 Mar. 2017, www.fukushimaontheglobe.com/the-earthquake-and-the-nuclear-accident/evacuation-orders-and-restricted-areas.
- Reid, Kathryn. “2011 Japan Earthquake and Tsunami: Facts, FAQs, and How to Help.” World Vision, 29 Feb. 2020, www.worldvision.org/disaster-relief-news-stories/2011-japan-earthquake-and-tsunami-facts.
- “Study on Individual Radiation Doses Kept Secret for 6 Months.” Fukushima on the Globe, 1 May 2014, www.fukushimaontheglobe.com/the_earthquake_and_the_nuclear_accident/3583.html.
- “What is Background Radiation?” World Nuclear Organization, http://www.world-nuclear.org/uploadedFiles/org/Features/Radiation/4_Background_Radiation%281%29.pdf.
- “Designated Experts to Observe Collection of Marine Samples near Fukushima Daiichi Nuclear Power Station.” IAEA, IAEA, 30 Oct. 2020, www.iaea.org/newscenter/pressreleases/iaea-designated-experts-to-observe-collection-of-marine-samples-near-fukushima-daiichi-nuclear-power-station.
- “Marine Monitoring: Confidence Building and Data Quality Assurance Project.” IAEA, IAEA, July 2017, https://www.iaea.org/sites/default/files/project-report270717.pdf
- Smith, Jim T., et al. “Time Trends in Radiocaesium in the Japanese Diet Following Nuclear Weapons Testing and Chernobyl: Implications for Long Term Contamination Post-Fukushima.” Science of The Total Environment, Elsevier, 8 June 2017, www.sciencedirect.com/science/article/pii/S0048969717313487.
- “530 Minamisoma Residents Sue Government over Hot Spot Delisting.” Fukushima on the Globe, 24 June 2015, www.fukushimaontheglobe.com/citizens_movement/litigation-movement/4418.html.
- “Nuclear Reactor Hit by 2011 Tsunami Passes Safety Screening.” Kyodo News , KYODO NEWS , 26 Feb. 2020, www.english.kyodonews.net/news/2020/02/abe2becb3bef-nuclear-reactor-hit-by-2011-tsunami-passes-safety-screening.html.
- Mecklin, John. “Onagawa: The Japanese Nuclear Power Plant That Didn’t Melt down on 3/11.” Bulletin of the Atomic Scientists, 28 June 2018, www.thebulletin.org/2014/03/onagawa-the-japanese-nuclear-power-plant-that-didnt-melt-down-on-3-11/.
- The Fukushima-Daiichi plant. Photo by Richard Atrero de Guzman/AFLO/Alamy Live News (Pictured at top)