This is follow-up, technical analysis of beach sands found at Half Moon Bay.
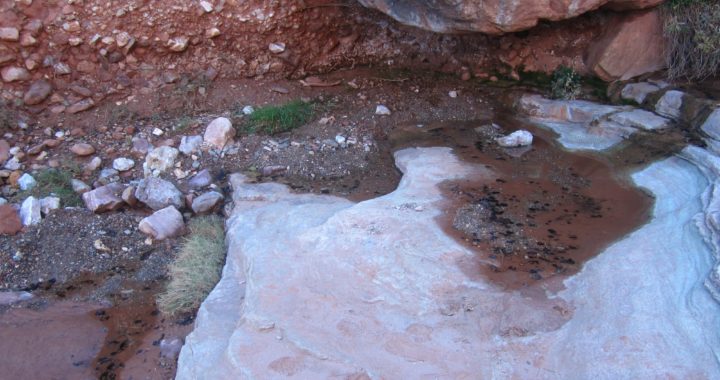
While we were out at Half Moon Bay we wanted to collect samples that we could take back to the lab for more careful analysis. Here we present the results of this sampling and quantitatively present our results. Previously, we found that mostly Uranium and Thorium isotopes were contributing to the increased count rate along the beach, and we wanted to measure the concentrations of these isotopes present in the sand. The locations we sampled can be seen on the map below (Fig.1). These samples were then measured in a sensitive, low background High Purity Germanium Detector (HPGe) to identify the naturally occurring sources of radiation.
The naturally occurring radionuclides, Uranium-238, Thorium-232 and Potassium-40 were specifically assayed for concentration. The sand measurements show that the concentration on the beach is higher than the concentration on the approach to the beach and the variation in the count rates is quite large.
Trace amounts of Cs-137 were also identified, although the majority of this is residuals from atmospheric testing of nuclear weapons. The isotope Cesium-134 is not detected; its presence would have been a definitive indicator of material from Fukushima. The variations that we see in the measurements are a result of varying U,Th concentrations in the soil. These isotopes are found in different concentrations depending on the site’s geology.
Sample Locations
The locations in the tables correspond to the map shown below from the Surfer’s Beach report:
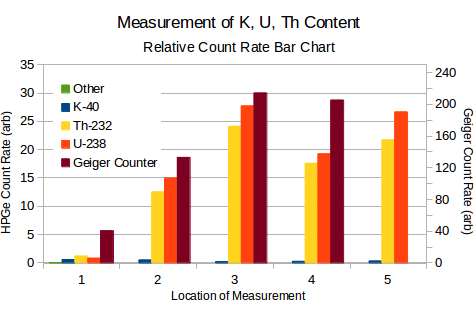
Samples were taken from locations 1-5 on the beach at Half Moon Bay. The red bars indicate readings taken by a Geiger counter.
Table of Results:
| Location | Depth below surface | K-40 (natural) [Bq/kg] | U-238 (natural) [Bq/kg] | Th-232 (natural) [Bq/kg] | Cs-137 [Bq/kg] | Cs-134 [Bq/kg] |
|---|---|---|---|---|---|---|
| 2 | 0″ | 72.5 | 714 | 562 | ND (<0.52) | ND (<0.49) |
| 2 | 1″ | 272 | 301 | 239 | 0.19(7) | ND (<0.11) |
| 3 | 0″ | 67.9 | 714 | 507 | ND (<0.48) | ND (<0.45) |
| 3 | 1″ | 59.3 | 688 | 553 | ND (<0.52) | ND (<0.46) |
| 4 | 1″ | 217 | 367 | 312 | ND (<0.15) | ND (<0.14) |
| 5 | 0″ | 403 | 25.3 | 24.6 | ND (<0.06) | ND (<0.05) |
| 5 | 2″ | 366 | 33.9 | 40.9 | ND (<0.07) | ND (<0.06) |
| 6 | 0″ | 413 | 33.0 | 24.9 | 0.37(5) | ND (<0.05) |
| 6 | 1″ | 218 | 395 | 322 | ND (<0.41) | ND (<0.37) |
There is a 1% uncertainty in the K-40, U-238, and Th-232 values stated above.