Measurements at Miramar Surf (Surfer’s Beach)
Ryan Pavlovsky
January 22, 2014
Document Outline
- Overview
- Measurements and Results
- Conclusions
- Other Interesting Articles
- Brief Technical Description
- FAQ
Overview
Surfer’s beach near Half Moon Bay, California has been in the news a lot in the past several weeks over a Youtube video featuring a Geiger counter making measurements in the area. The reason this has gotten so much attention however is that the video was repurposed to claim that the readings observed were due to radiation from the Fukushima nuclear accident. This has been widely and appropriately refuted. There are some particularly good articles out there, such as this one from the LA Times, and a comprehensive analysis with supporting links can be found at Deep Sea News.
These reports are accurate, however we wanted to show that it is possible to get a much better idea of what causes these variations (using more sophisticated instruments) and also explore what limited information Geiger counters can actually provide.
First of all the conclusion: the count rate increase observed was not due to man-made sources of radioactivity. Yes, this rules out Fukushima. We did find, as many others have found, that there are variations in the natural radioactive background due to varying concentrations of Uranium and Thorium. The radionuclides that cause this change in background are found in almost all soils, with concentrations varying based largely on the geology of the area.
We will present here a summary of measurements with a Geiger counter (for reference) and a portable high resolution gamma-ray spectrometer for a much more precise determination of the origin of the count rate increase. The Geiger counter was also used to choose measurement locations as can be seen in figure 3. For clarity we have moved a lot of the details to the last section (Brief Technical Description).
Measurements and Results
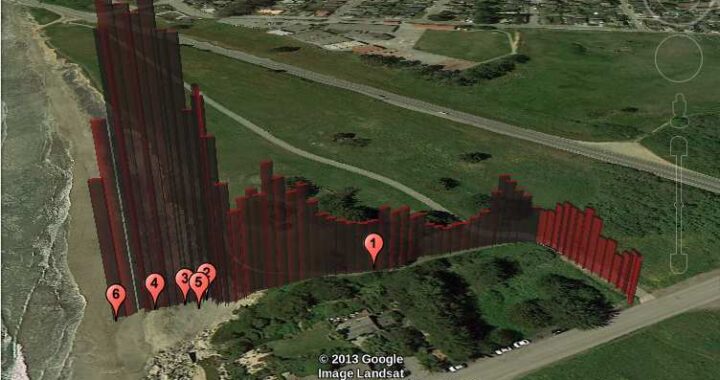
In order to find areas that we would like to analyze in depth we first performed several surveys of the beach and surrounding areas with a Geiger counter. One search has been plotted on Google Earth against gross count rate in figure 1. One can see that the count rate generally increases as we make our approach to the beach. This seems to replicate the effect claimed by news reports and by the Youtube video.
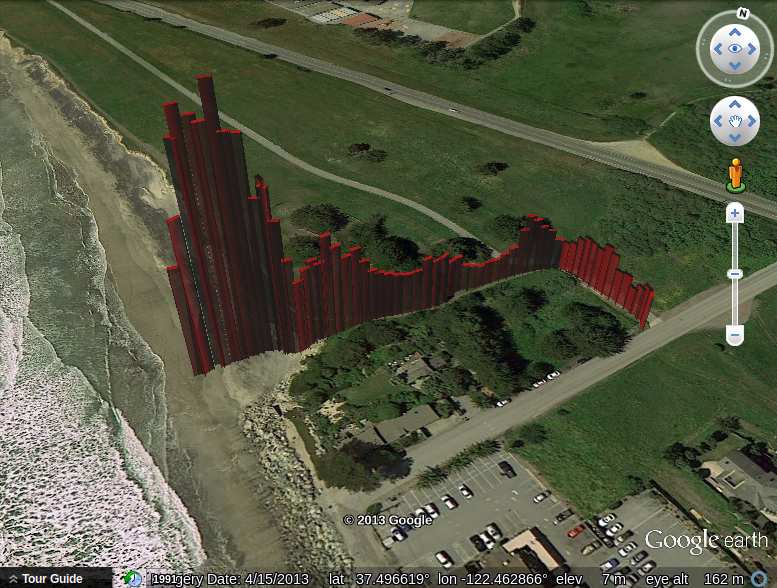
Figure 1: This bar graph shows the CPM Geiger readings. We used this information to choose our sample locations (figure 3). Beyond search scenarios the meter is not really useful, as it provides very low quantity/quality data. In order to answer questions like ‘Is this radiation from Fukushima?’ we really require a more sophisticated instrument called a gamma-ray spectrometer (see figure 2). Figure 3 shows measurement locations where samples were taken.
In order to determine what was causing the increased count rates we took several ∼15min measurements with the high resolution spectrometer pictured in figure 6. In order to make a fair measurement we have to use locations that are both interesting and comparable. This means selecting areas that have approximately the same geometry and solid angle obstruction.
Since gamma-ray energies and abundances are very specific to the source which emits them we can identify the exact isotopes or types sources from which they emanate. This method of identification is both very specific and very sensitive when enough gamma-rays have interacted with our spectrometer. The information that we get from these types of detectors are counts vs. the gamma-ray energy and can be seen in figure 5. The region below the sand that we are sensitive to is likely around one quarter to one half a meter.
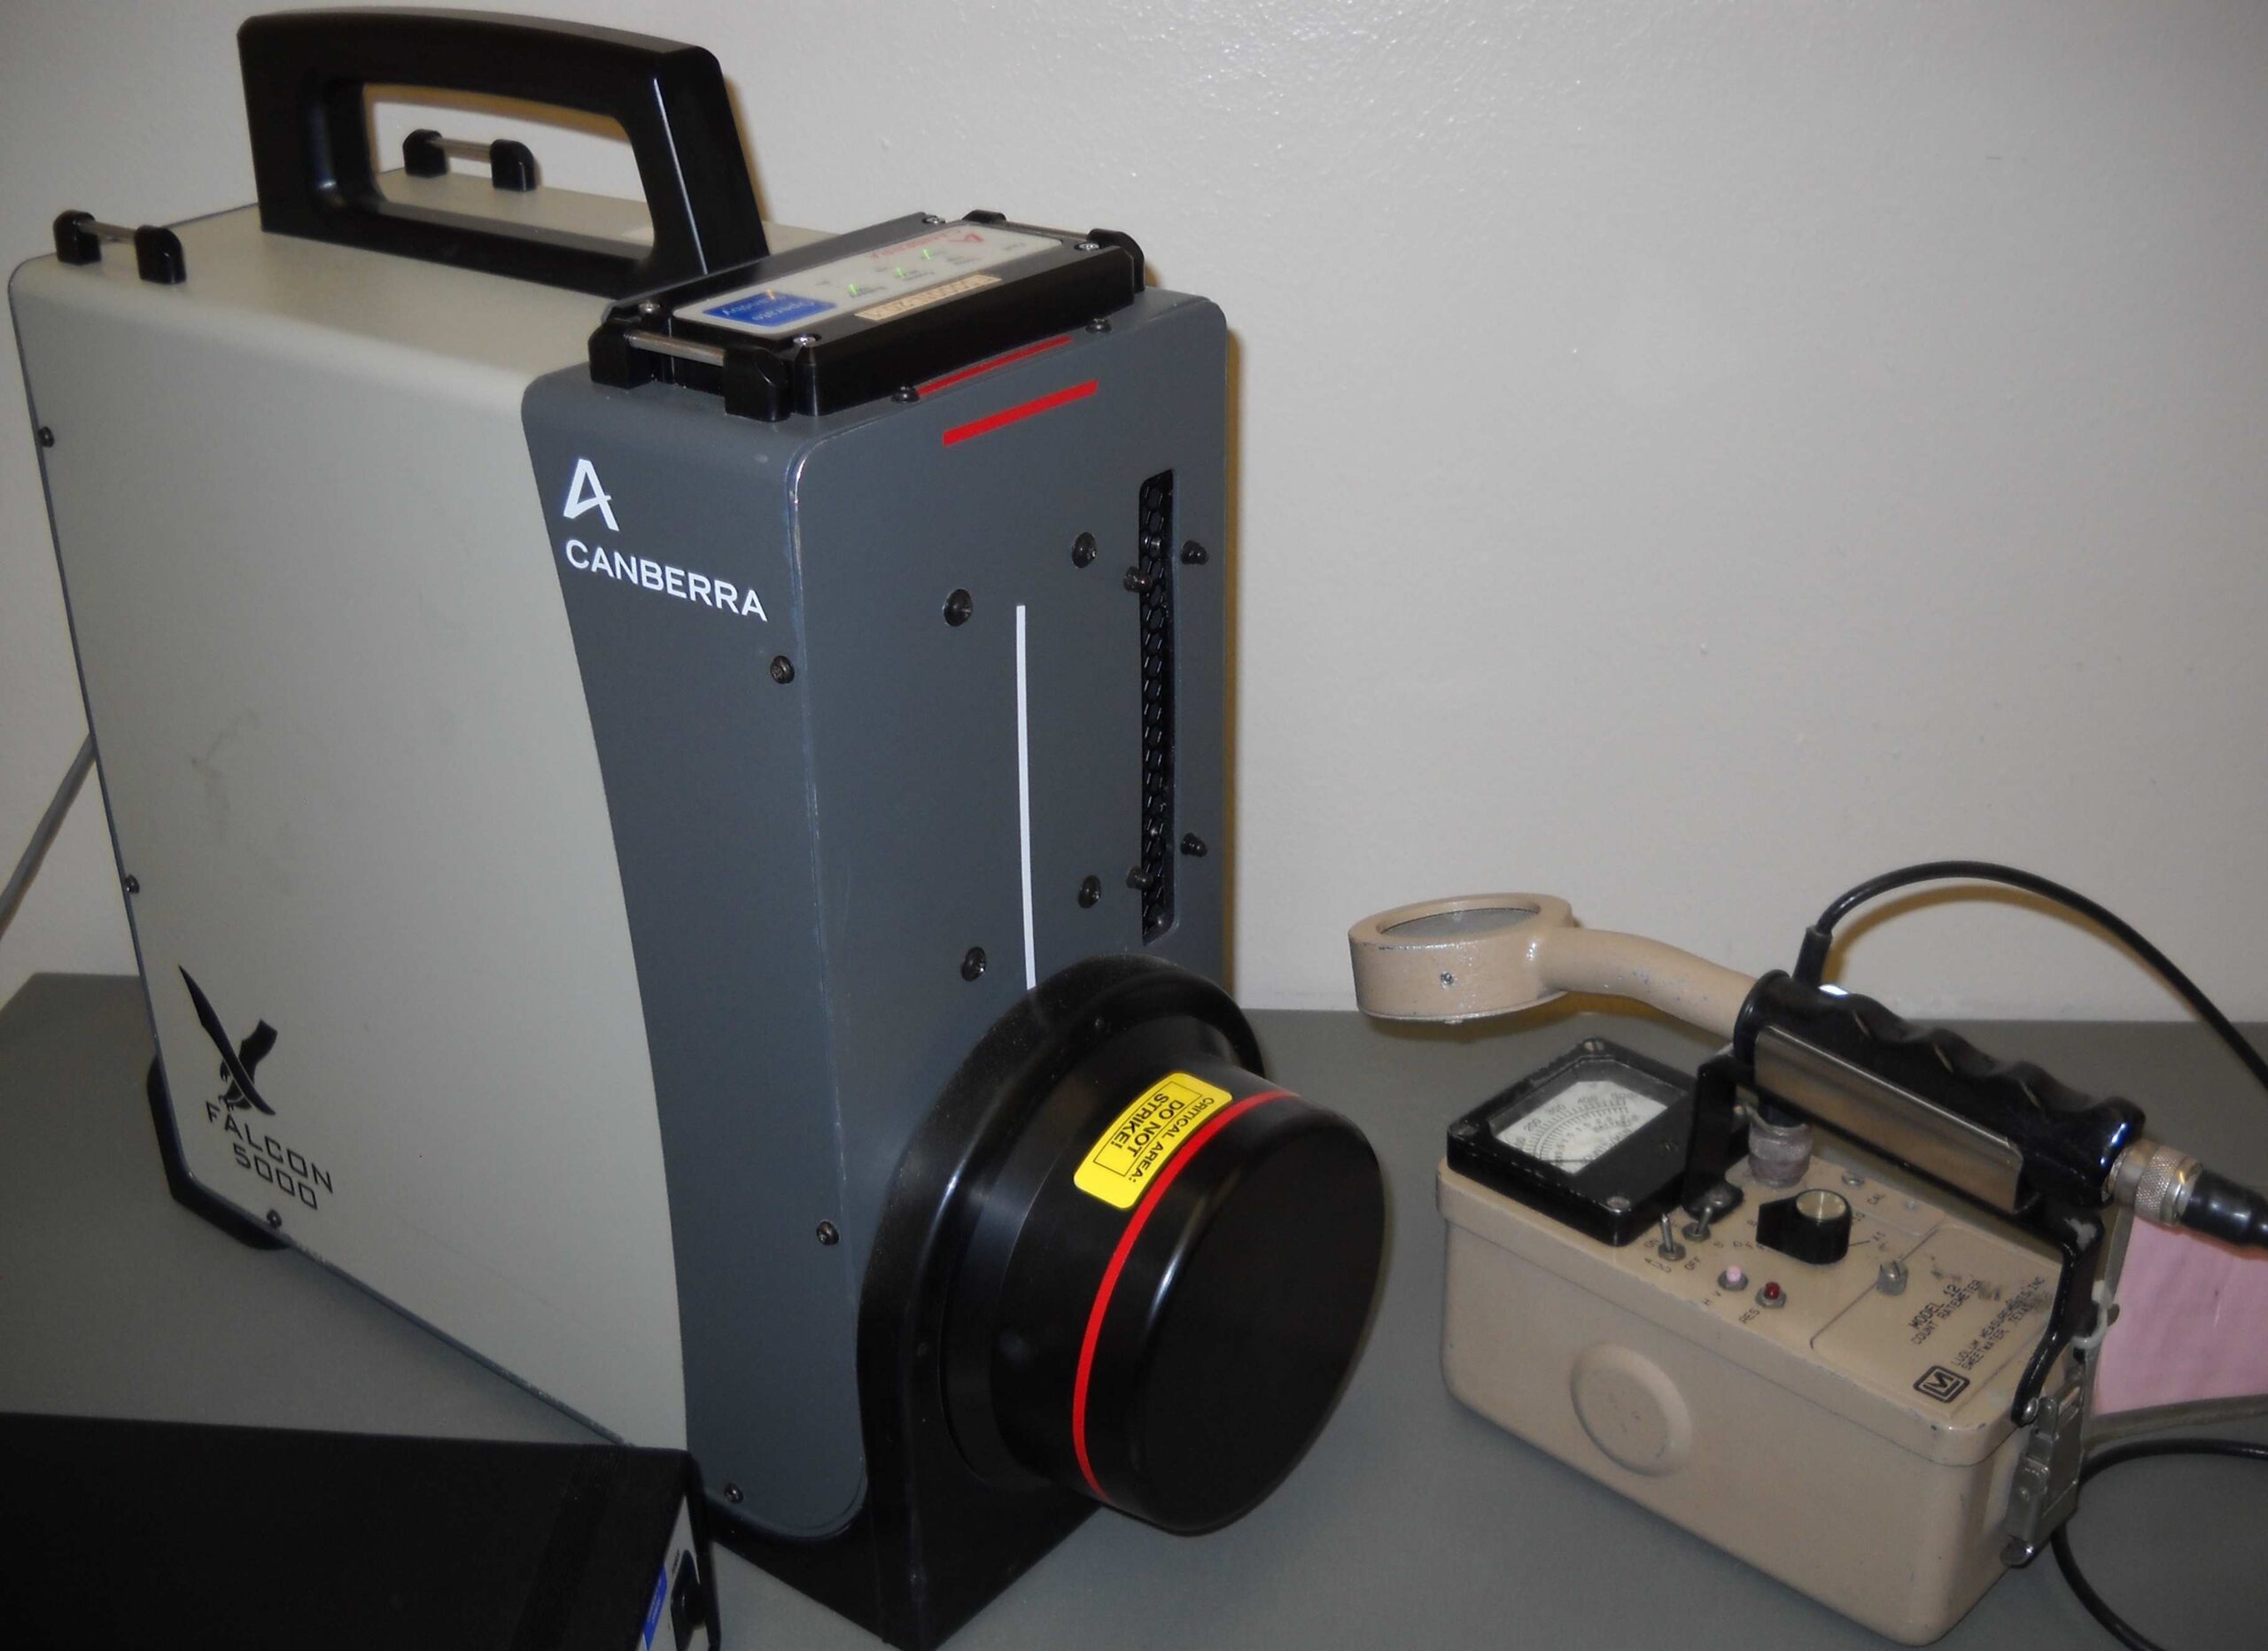
Figure 2: (Left) A Canberra portable high purity germanium (HPGe) spectrometer and (right) a Ludlum Geiger counter. The spectrometer provides much more information about the gamma radiation being detected as can be seen in figure 4 and figure 5. Unfortunately only the Geiger counter is in the realm of affordable for an individual.
Now we can show what is really producing our increased count rate in our sample locations. If we take all the spectra acquired from the locations in figure 3 like those in figure 5 we can produce a graph like figure 4. This shows the count rate for each of the contributing factors in the spectral content of the measurements. It should be mentioned that it is not Uranium-238 or Thorium-232 which produce the increased count rate but the products which follow after them in the decay chain. What is clear is that the count rate increase is overwhelmingly due to these series and that the variance between high and low at the locations measured is about a factor of 5 to 10.
It is somewhat hard to see in this in figure 4 however the variation from 238U to total count rate seems to be higher. When the count rate for 238U increases by a factor of 2 over the reference location the 232Th increases by a factor of 1 over the reference location in our spectrometer.
In order to investigate the concentration of the soil content we have also taken some sand samples for analysis. Since this will take a little more time to complete the analyses in the lab, we will defer the posting of concentrations until our samples have been processed. We should be updating the site within a week to report our findings. I will try to supply a link when these results are in!
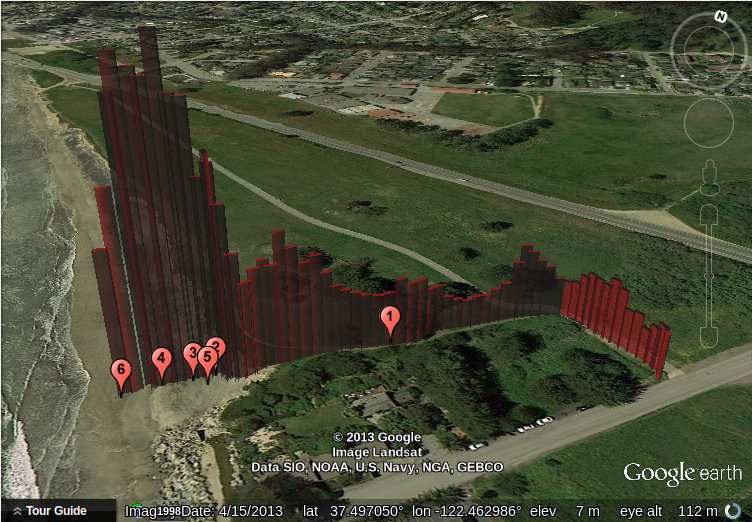
Figure 3: Locations 1-5 were sampled with the HPGe detector and the results are shown in figure 4. Sand samples were also taken for comparison at the other locations but will take some time to process. They should be similar to figure 4. No data is provided for 6 (yet!) in figure 4 because we didn’t want to get caught in the surf!
Conclusions
We have shown results of measurements taken at Surfer’s beach and approximately confirmed the count rate variations seen in the viral video with our own Geiger measurements. More importantly however, we have investigated the issue further in the isotopic analysis we presented to argue that the count rate increases were due to increased concentrations of 238U and 232Th in the sand near the beach. We have also shown that the amount of man-made radioactivity contributing to the total count rate is very low in comparison with the natural background and its variations.
The conclusion from this is that the beach has likely been in this geological state for a very long time, certainly much longer than 5 years. The increased risk due to the natural variations in the radioactive background is no greater today than it was many generations ago.
We have also demonstrated that natural radiation levels can vary a lot. Despite this the actual dose you receive from your terrestrial environment is surprisingly low. See this USGS graphic on the average annual dose recieved by individuals in the US. Unless you are a smoker, the dose from Radon in California is somewhat lower than in other states due to environmental factors and lifestyle habits. People who live in colder climates (they are more likely to stay indoors) and houses with ill-ventilated basements tend to get more Radon dose.
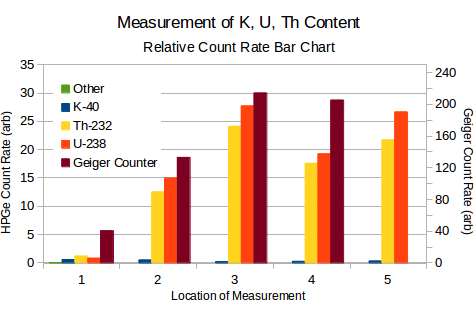
Figure 4: A comparison of the count rate for the spectral content of the measurements. One can see that these are overwhelmingly due to Potassium-40, Uranium-238 and Thorium-232. Here the count rate for each isotope and its daughters at each location are summed. The ‘other’ category includes all other spectral count rates that are not from K-40, U-238, or Th-232. These ‘others’ are simply summed together. As one can see from the chart these are barely observable compared to the 40K, 238U , and 232Th content. These isotopes are found in almost all soils with varying concentrations.
Other Interesting Articles
- People in Santa Cruz are vigilant! And it’s not just scientists. While you practically cannot identify radiation from Fukushima with a Geiger counter it is good that people are becoming informed about their natural radioactive background! Efforts like this are crucial to begin public education about radioactivity.
- Future monitoring efforts will be ongoing, see the news article about our newest project here. We will update the links when we have results.
- If you don’t fit either of these general audiences we described in the article you can calculate your own dose on the American Nuclear Society website.
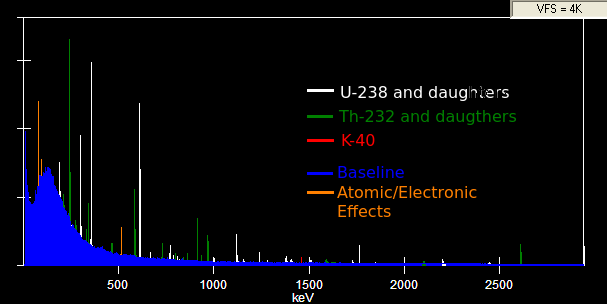
Figure 5: An example HPGe spectrum. This is measurement was made in a similar geometry to figure 6. The count rate we are interested in is the peak height above the ‘baseline’ or background near the peak. Note that most of the spectral count rate is due to the 232Th and 238U daughters.
Brief Technical Description
For comparison we made measurements with two instruments: a Ludlum Geiger counter on the fast integration setting and a Canberra Falcon 5000, a mechanically cooled, portable high purity germanium detector. An Arduino GPS module and TomTom GPS watch were used for coordinate acquisition.
We conducted an approximately 200m measurement with the Ludlum meter held at about waist height and the ‘pancake’ probe at a fixed orientation. The readings are plotted in figure 1. The variation between high and low was seen to be about a factor of 5.
Additionally we wanted to investigate the isotopics of the count rate increase. We used the HPGe detector to acquire spectra as seen in figure 6 with the detector set on the ground near the measurement site. The locations chosen were on the beach and can be seen in figure 3. The major contributors in count rate at the different locations were plotted in figure 4. One can identify the increase as largely due to the increased concentration of 238U and 232Th. These variations are well studied by the USGS on a 2km grid however the scale of interest is on the order of several meters in this location. The measurements take from figure 3 are only about 2 to 4 meters apart. The geology of the area appears to be Quartenary rock/silts/muds. We would also note that the black sand somewhat correlates with count rate. The USGS has also done in depth studies of black sand and coastal black sand of this area. Note however that there are few measurements in the actual location we studied. These are some, and are also among many, possibilities for the concentration increases. We will defer estimation of sand concentration until we have collected all of the necessary measurements.
It is worth mentioning that the decay chains listed can separate from each other based on the physical and chemical properties of the daughters. In particular the 238U decay chain daughters can be removed from secular equilibrium when 222Rn escapes from the 238U containing material. This is due to the fact that Rn is a noble gas and has a high partial presssure. Additionally the half-life of about 3.8 days gives the 222Rn plenty of time to be released from the material volume before decay. Despite this preliminary estimates show that the samples measured have mostly intact decay chains. The estimates of uranium content of the soil with the early and late daughters in the 238U decay chain seem to agree. The 232Th series does not separate as easily since the 220Rn has a half-life of 55 seconds.
FAQ
Are the radiation levels safe at Surfer’s Beach?
Yes. As we have said the count rate increase is due to variations in the natural radiation background. Moreover the beach geology has not likely changed significantly since people settled the area over several generations ago.
Do you think the count rate increase is due to man-made sources?
No. The data collected point to certain types of Uranium and Thorium which are commonly found in soil all around the world in varying concentrations. On a different note a Geiger counter cannot definitively measure radiation from Fukushima because it does not provide information about the energy of incident gammas. This is crucial to identification of the radionuclides that emit these signatures.
Do you plan to release your CPM readings from your Geiger counter?
No, while these readings are valid they do not significantly add to the data presented here. For example they do not produce the data to distinguish between man-made radiation and natural radiation. Additionally comparisons between Geiger counters in CPM can depend heavily on the type of meter used and the measurement geometry.
How are you connected to the University of California Berkeley?
I am a third year PhD student. You can contact me here, I will try to respond to inquiries as much as possible however I do have other commitments so please give me time to reply.
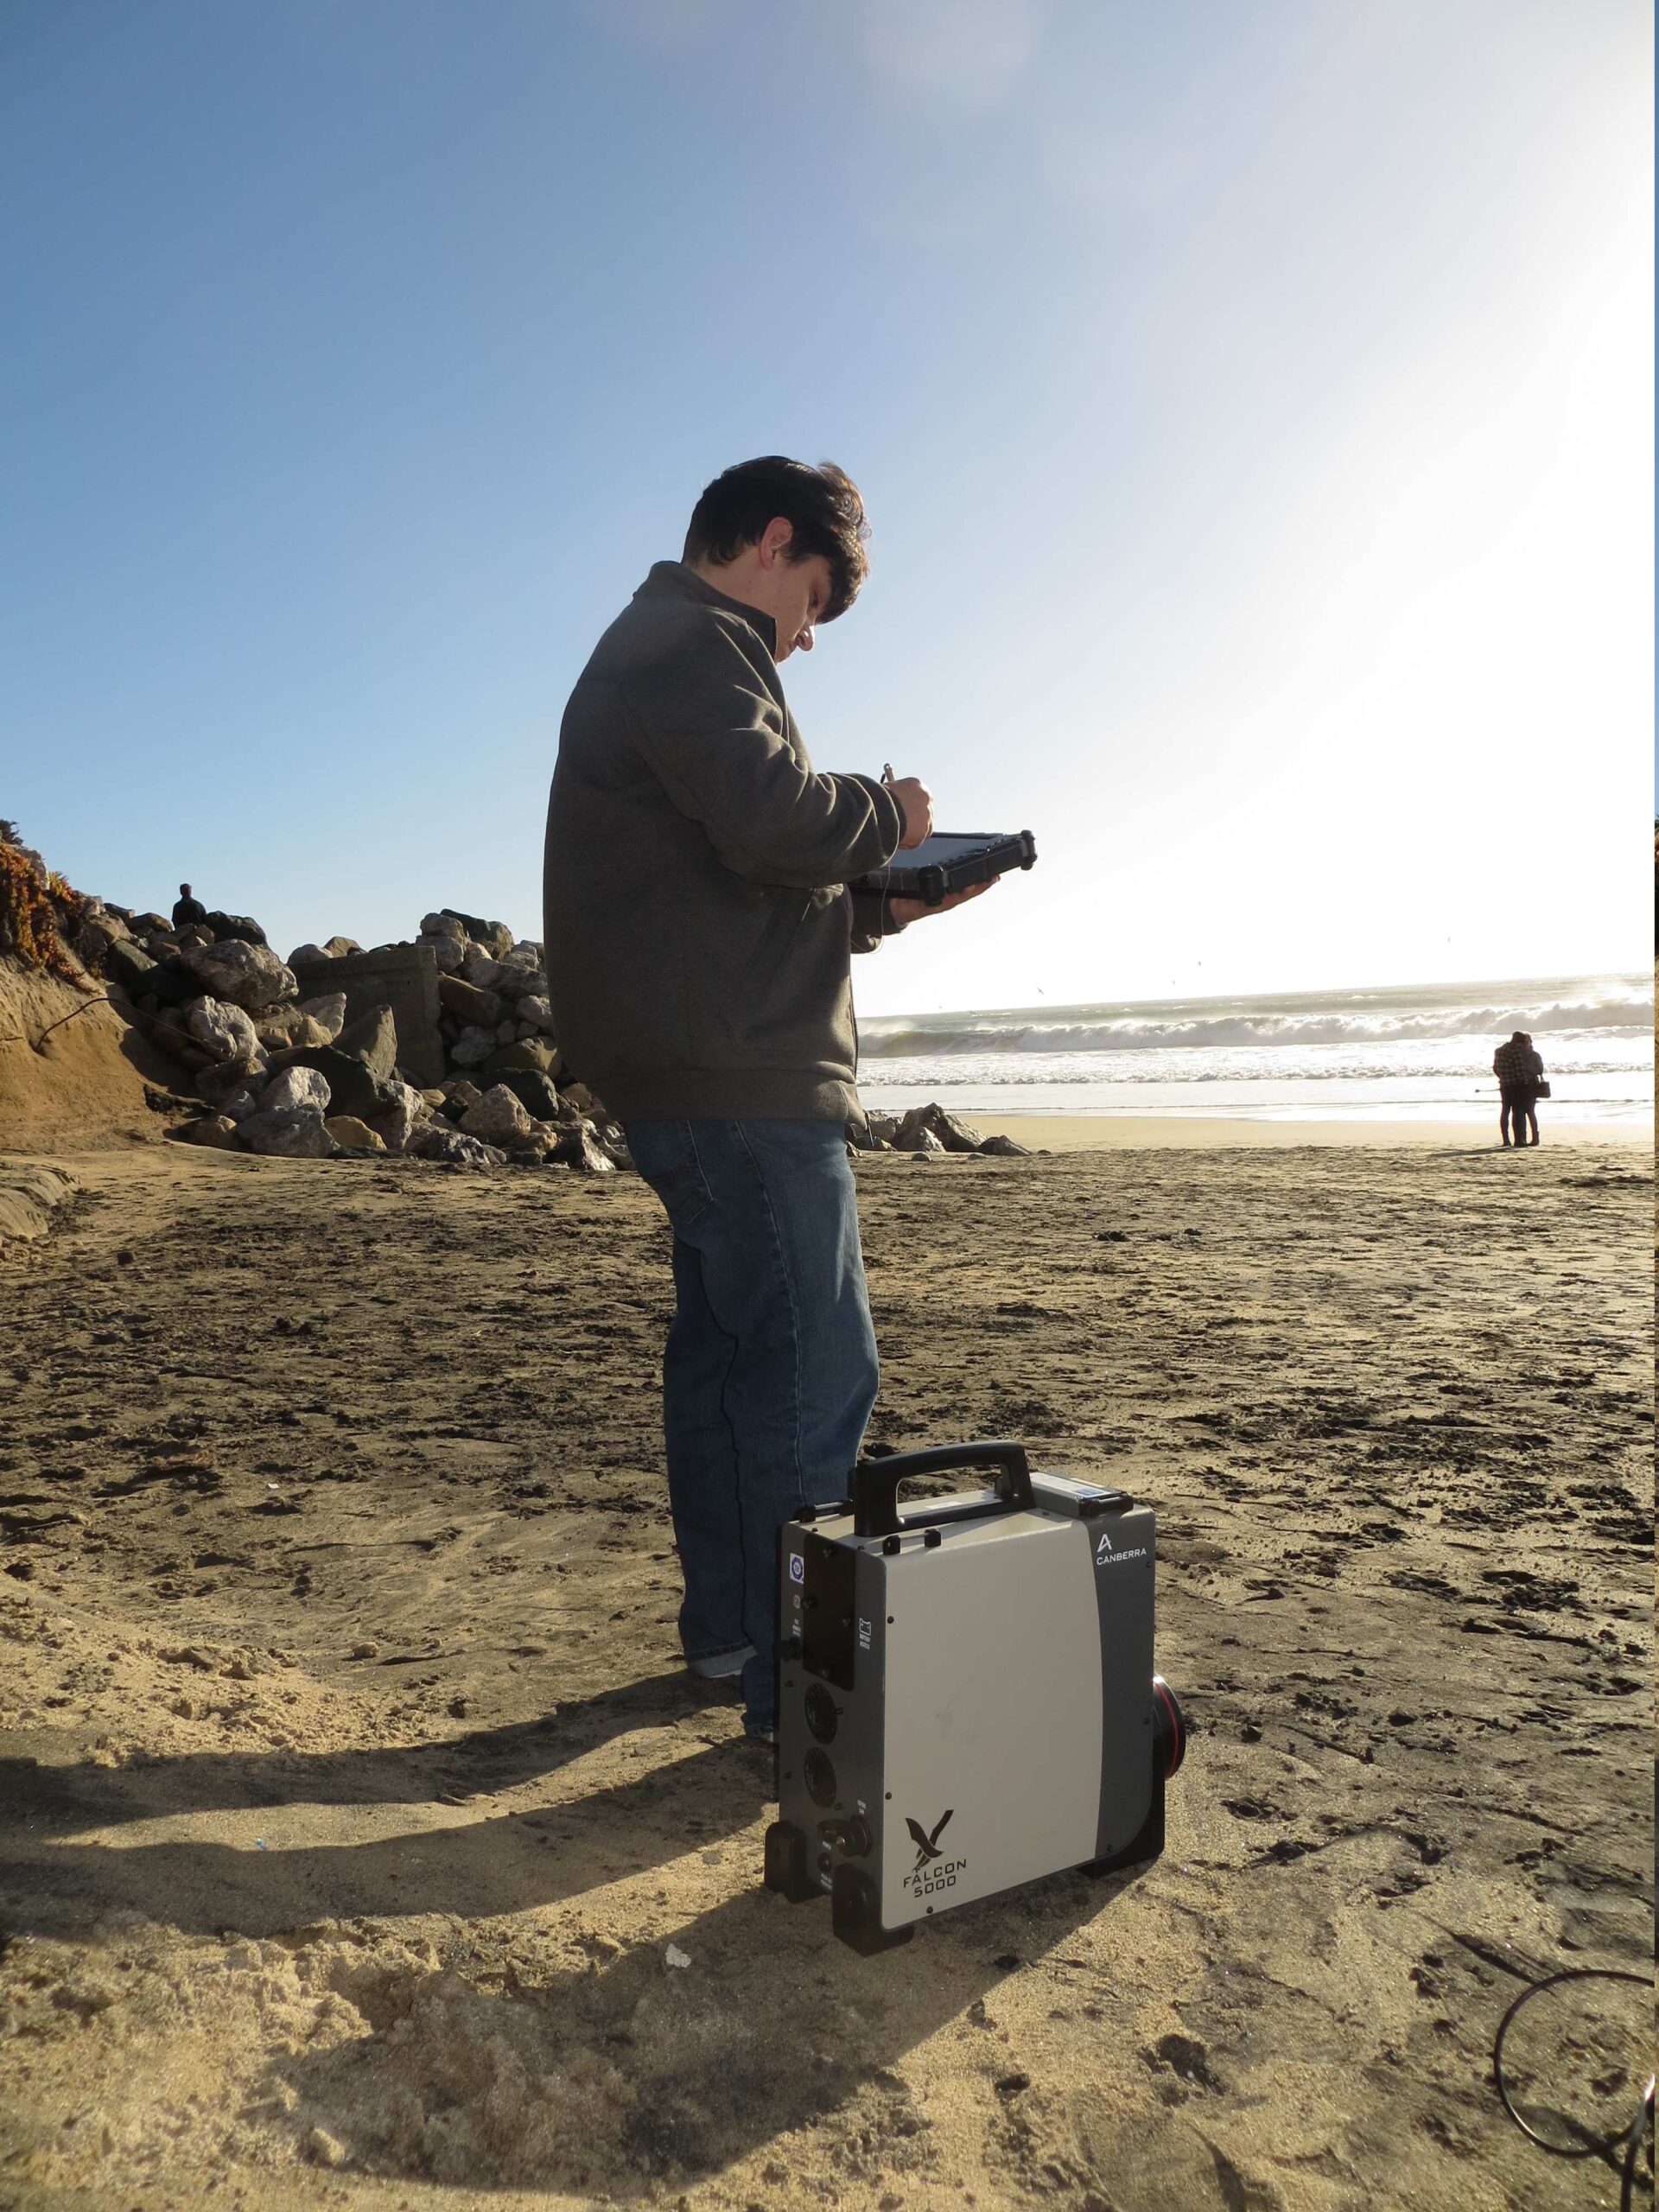
Figure 6: Taking measurements on the beach with the HPGe gamma-ray spectrometer.

