
Background
Since the 2011 Fukushima Dai’ichi nuclear power plant accident, there have been concerns about the radioactive releases from the power plant and the transport of radiation over the Pacific ocean. Part of our initial response was measuring a variety of food samples from the Bay Area environment. We have continued measuring natural radiation in environmental samples in order to inform the public as well as satisfy our scientific curiosity.
We have not detected isotopes from the Fukushima releases since 2012. The radioactivity we measured in the year following the accident was in small quantities in air and milk, available in our archive. We have never detected radioisotopes from Fukushima in quantities with measurable health effects. Below are summaries of the sample results since 2013, with additional information following.
All results except the Reference Samples have been produced using a new, automated analysis method, which will be presented in detail in an article coming soon. There may be marginal differences, within systematic uncertainties that should reflect such analysis method effects, in the numbers from the previous analysis version.
Current Measurements
The Summary plots (Figures 1-3) shown below include samples collected from 2013 on. All samples for each type are averaged in these figures, with the total number going into each result indicated. The full data-set going into these averages is presented in the Table in the Bay Area Environmental Sampling section.
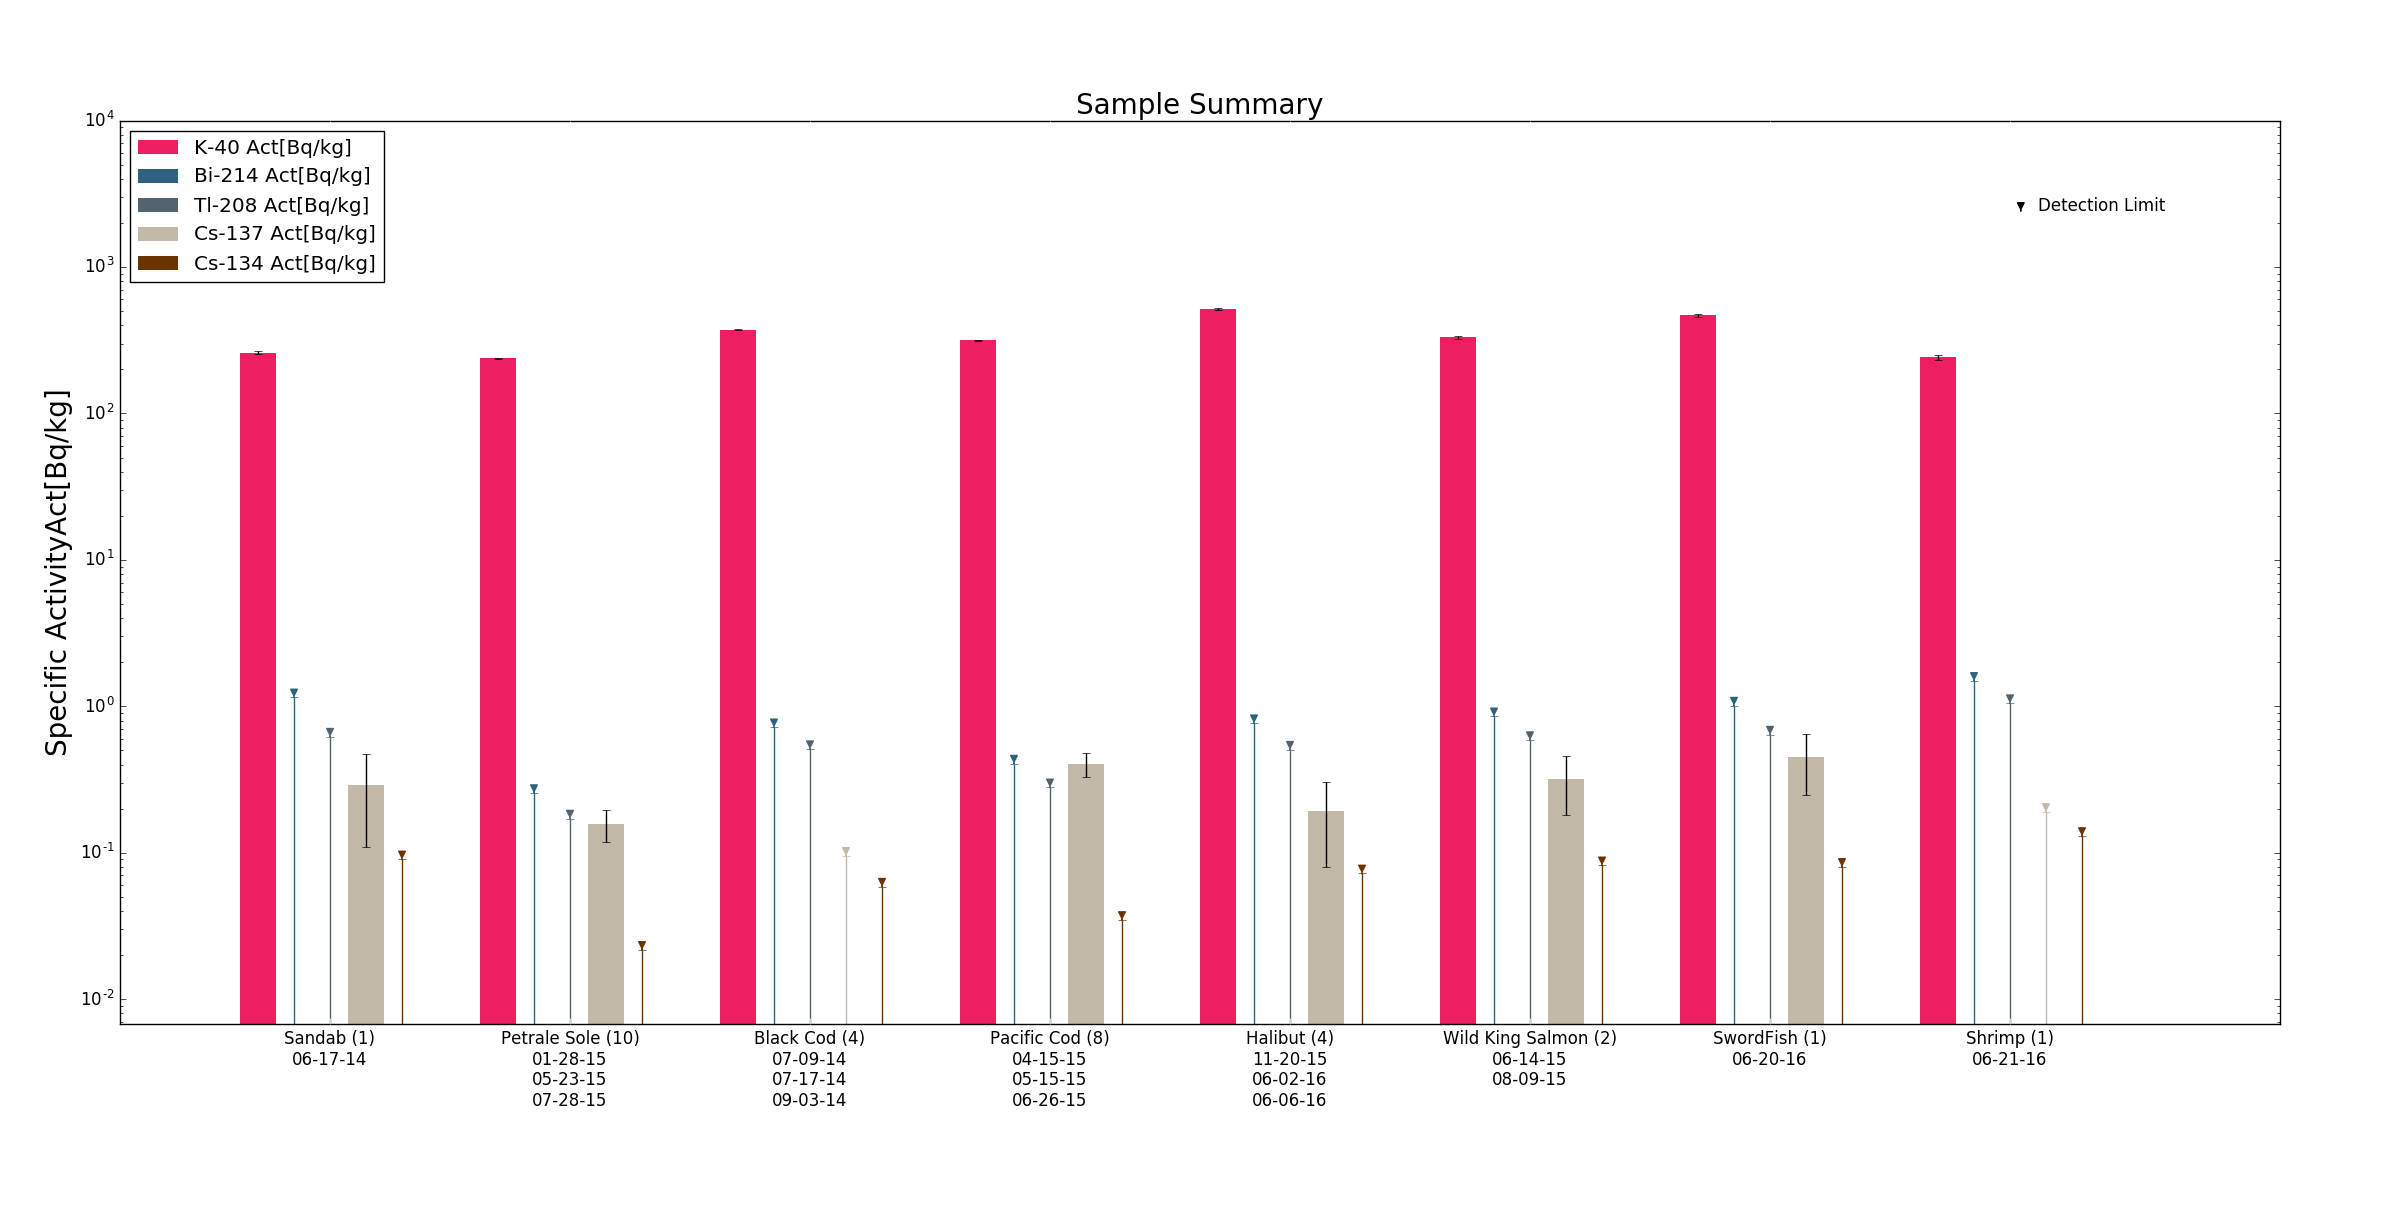
Fig 1. Summary figure of the current sampling data "Environmental Samples" including several types of fish collected from 2013-2015 as well as Swordfish and Shrimp collected in 2016.
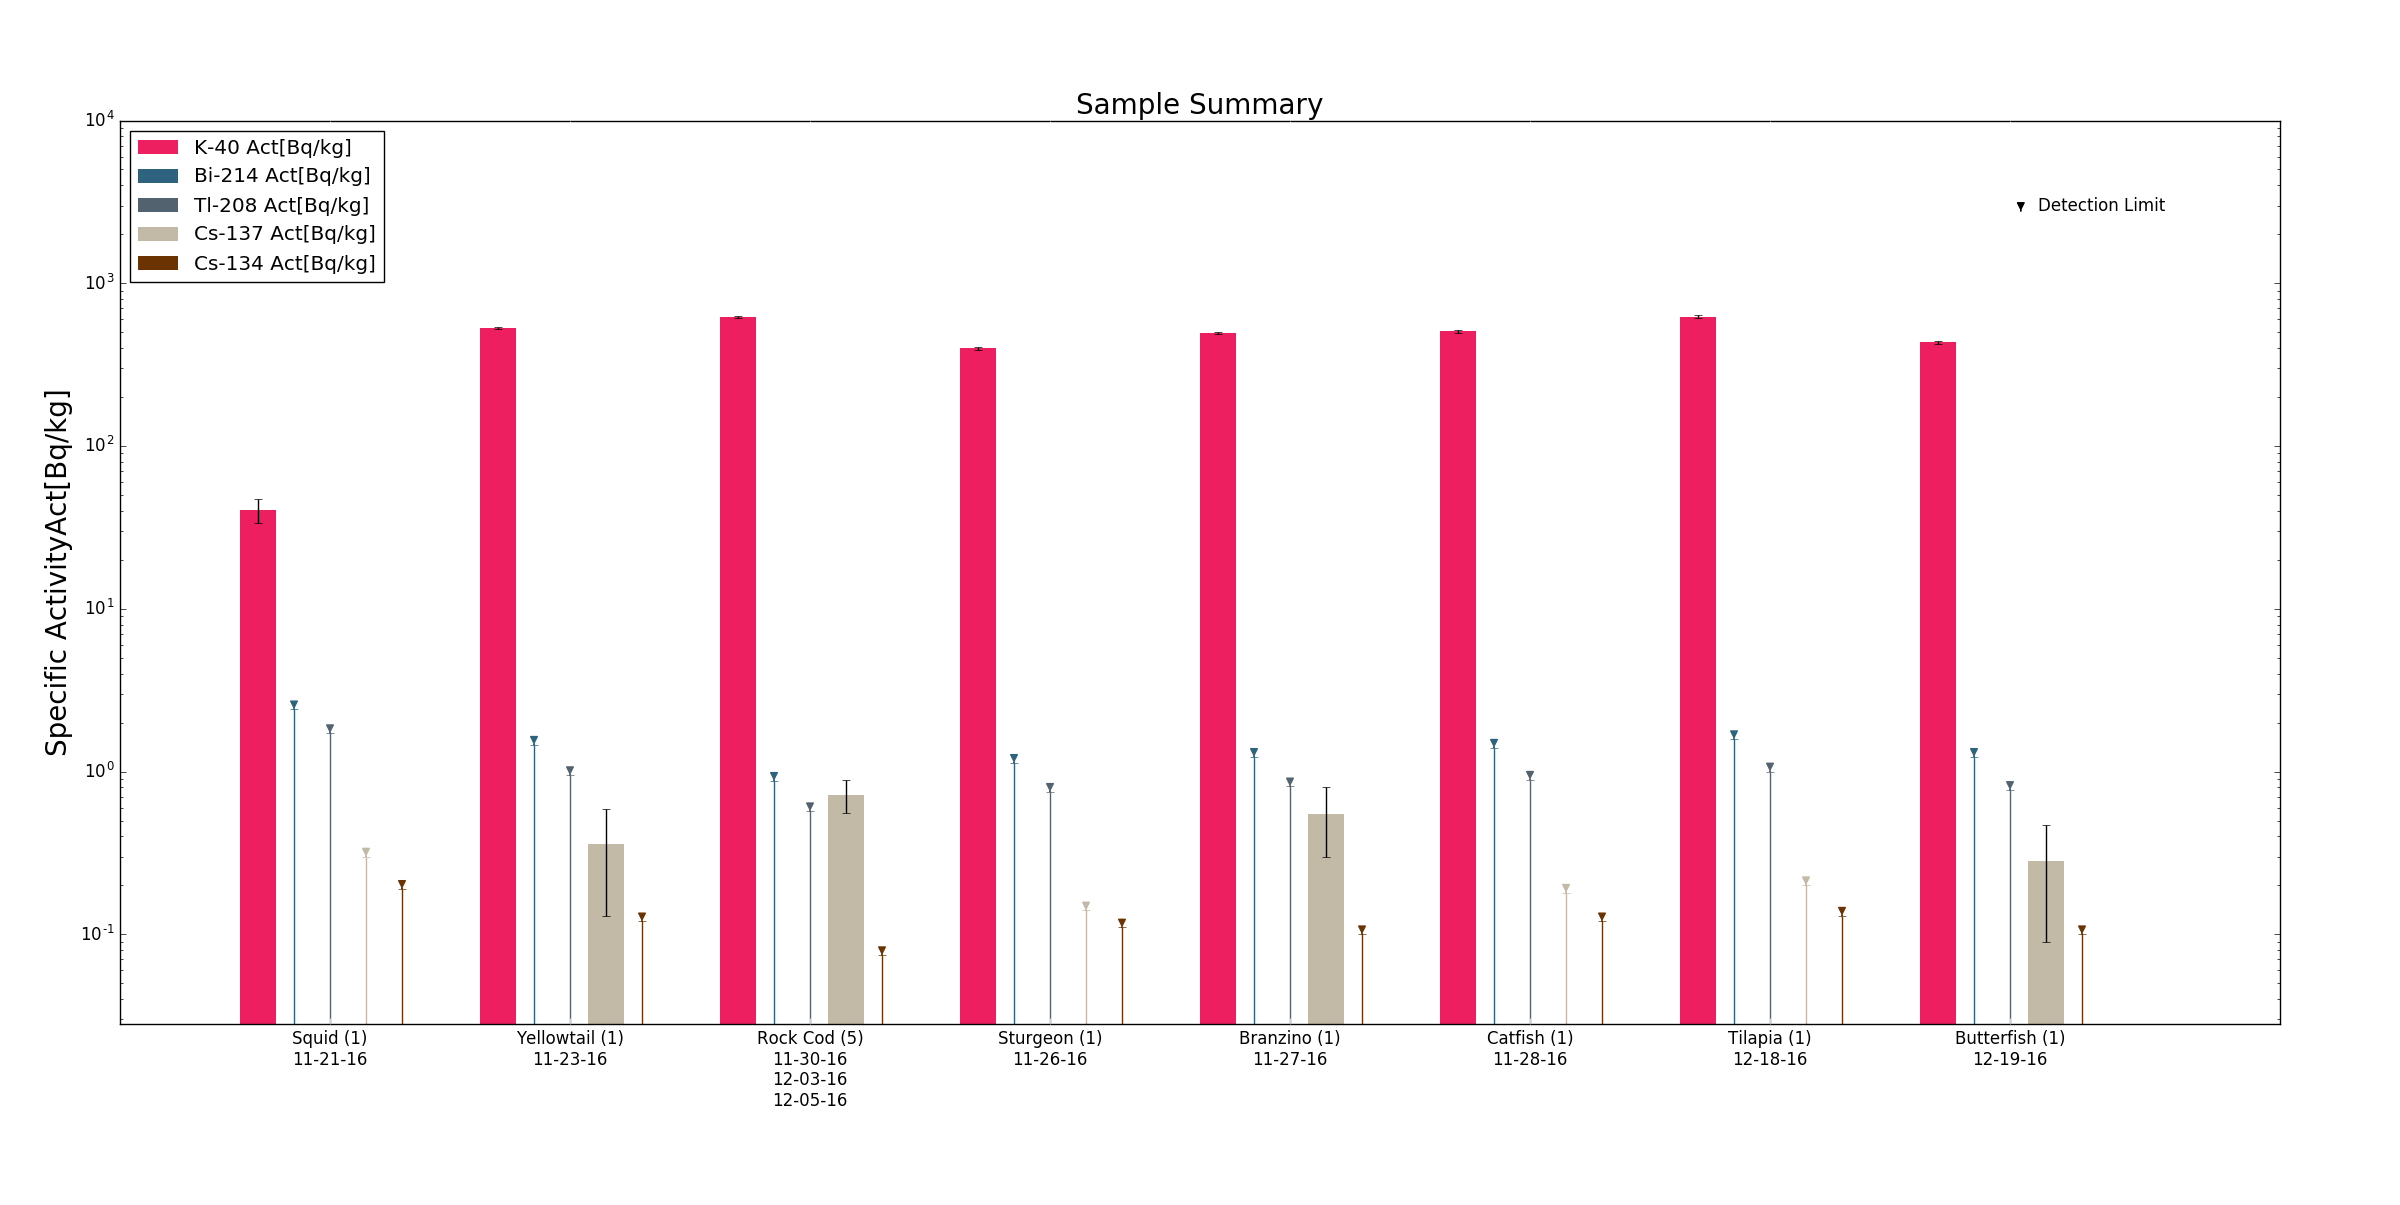
Fig 2. Summary figure of the current sampling data "Environmental Samples" including several types of fish all collected in 2016.
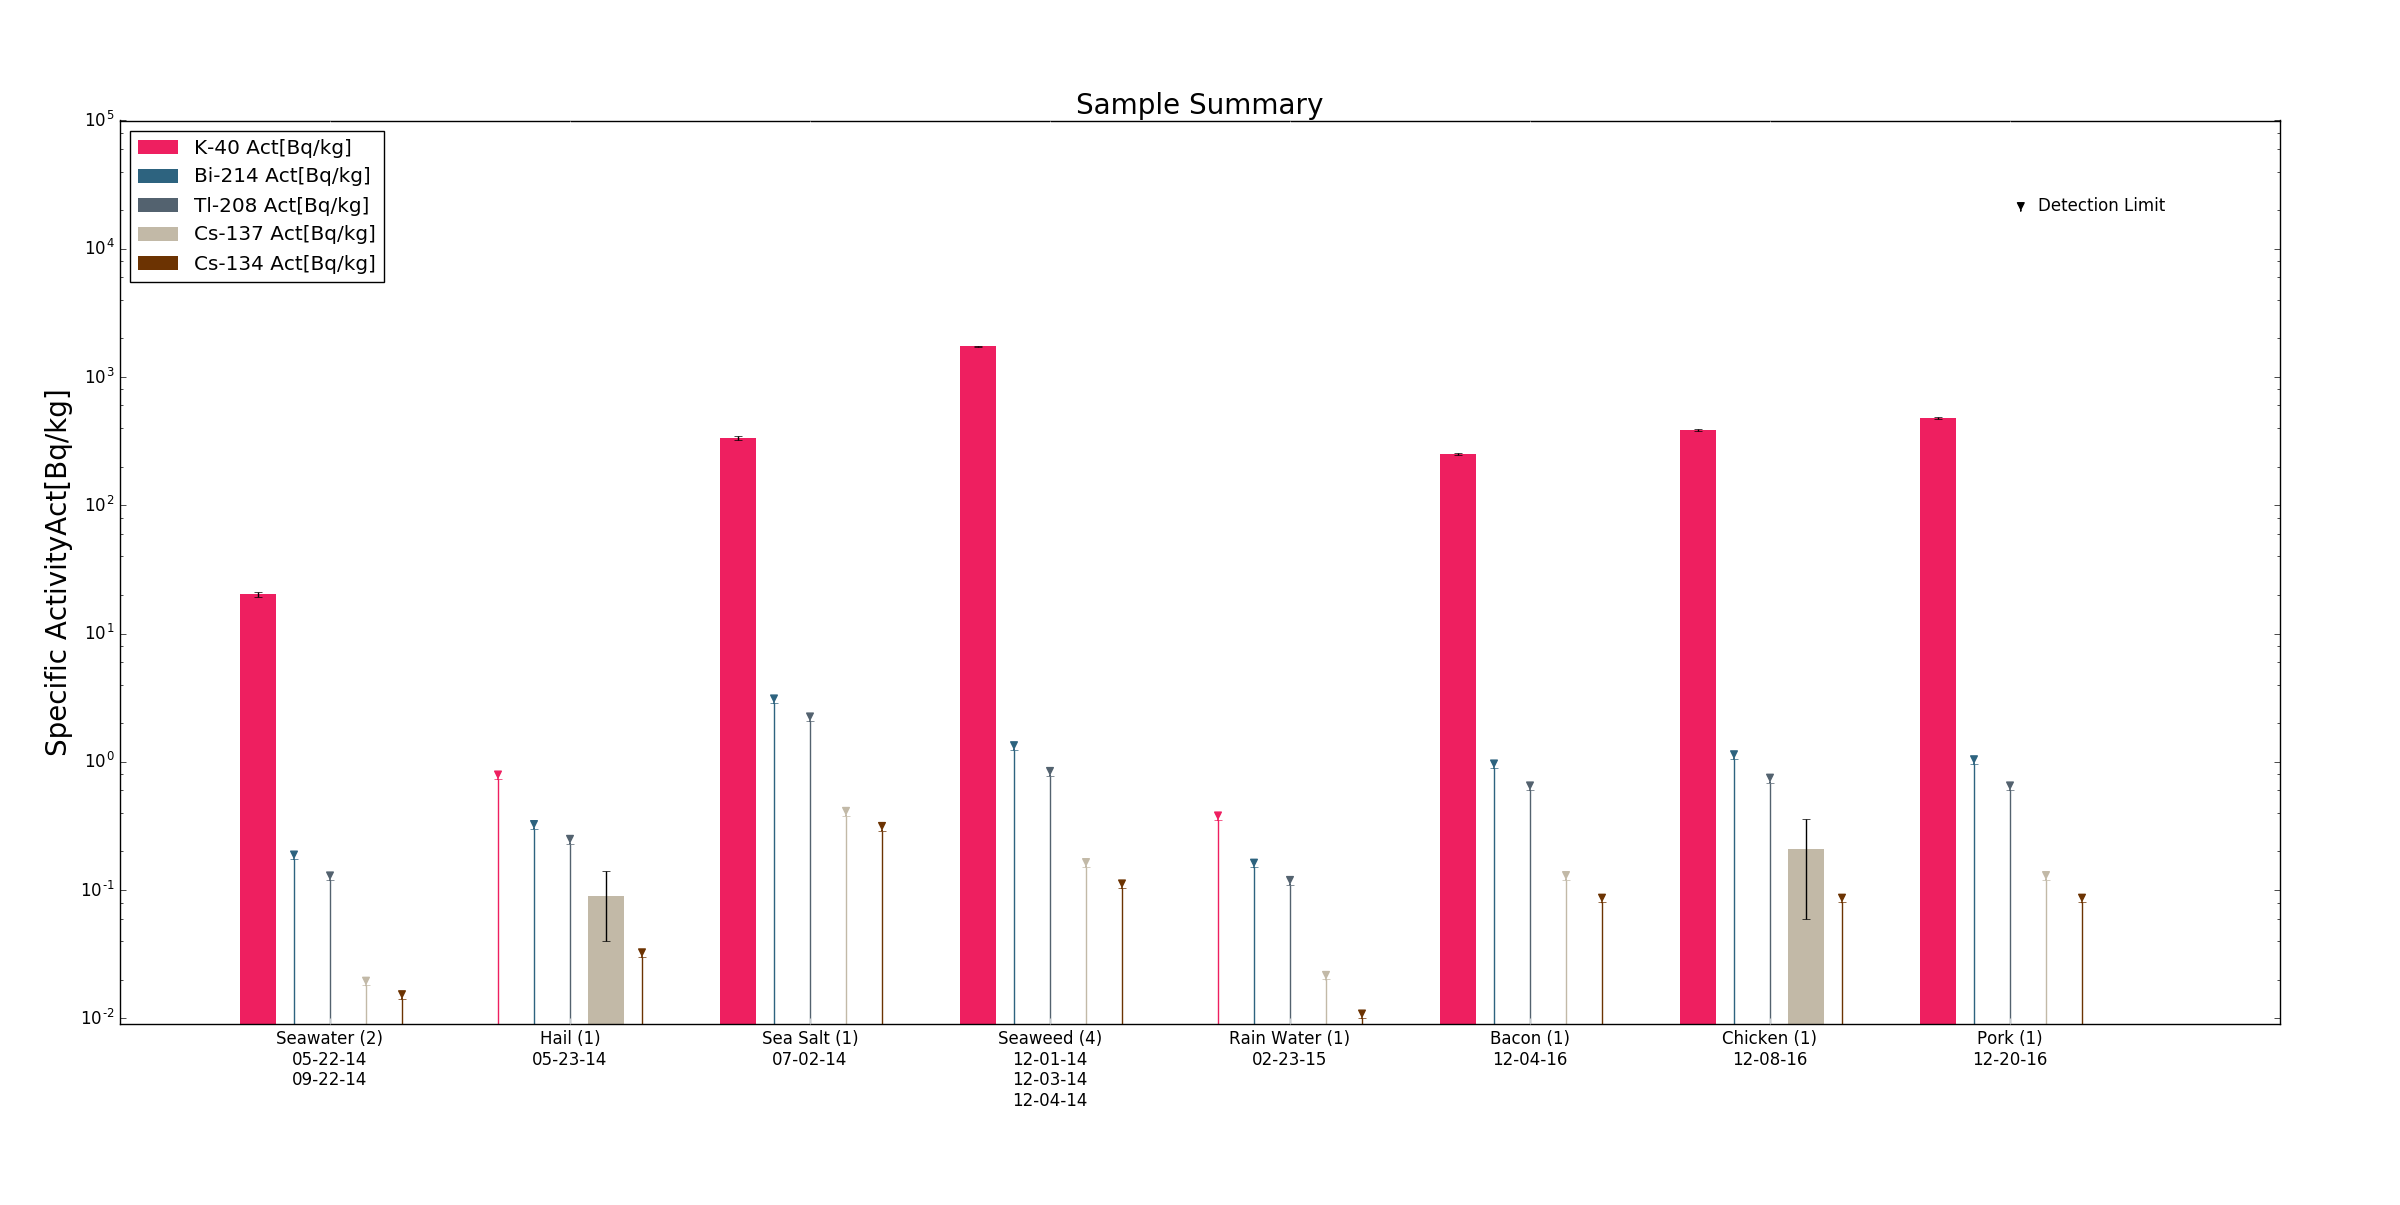
Fig 3. Summary figure of the current sampling data "Environmental Samples" from a range of miscelaneous sources including some consumer meat products.
What are we detecting?
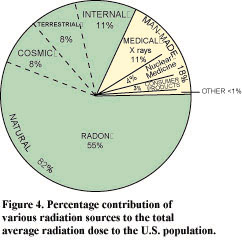
We are detecting mainly two sources of radioactivity, naturally occurring radioactive materials (NORM) and technically enhanced radioactive materials (TENORM). These constitute almost 82% of radiation exposure for US citizens. The following table describes the 5 radioactive isotopes that we look for in our samples.
Our measurements fall into two categories: those which are part of the Bay Area Environmental Sampling and those which may be used as References for putting those measurements into context. These two categories are divided into two tables for this distinction.
For those interested in why we commonly see these radioactive sources, above is a table of the origin of these radioisotopes.
Bay Area Environmental Sampling
These samples include many fish and environmental samples from around the Bay Area. "ND" means that the radioisotope was not detected in the sample. The isotope might still be present in quantities below the uncertainty value listed (which represents 95% confidence).
| Sample Type | Date Collected | Sample Size (g) | K-40 [Bq/kg] | Unc. K-40 [Bq/kg] | Bi-214 [Bq/kg] | Unc. Bi-214 [Bq/kg] | Tl-208 [Bq/kg] | Unc. Tl-208 [Bq/kg] | Cs-137 [Bq/kg] | Unc. Cs-137 [Bq/kg] | Cs-134 [Bq/kg] | Unc. Cs-134 [Bq/kg] |
|---|---|---|---|---|---|---|---|---|---|---|---|---|
| Sandab | 6/17/2014 | 234.5 | 260.46 | 7.81 | N.D. | 1.15 | N.D. | 0.62 | 0.29 | 0.18 | 0.02 | 0.09 |
| Petrale Sole | 6/23/2014 | 447.6 | 289.28 | 5.85 | N.D. | 0.73 | N.D. | 0.48 | 0.15 | 0.1 | 0.03 | 0.06 |
| Black Cod | 6/27/2014 | 195.4 | 462.39 | 11.2 | N.D. | 1.6 | 0.49 | 1.12 | 0.13 | 0.2 | N.D. | 0.13 |
| Black Cod | 7/9/2014 | 257.3 | 286.14 | 7.74 | N.D. | 1.21 | N.D. | 0.87 | N.D. | 0.16 | 0.02 | 0.11 |
| Black Cod | 7/17/2014 | 176.3 | 496.84 | 12.25 | N.D. | 1.75 | 0.09 | 1.22 | 0.27 | 0.25 | N.D. | 0.14 |
| Pacific Cod | 7/25/2014 | 303 | 354.32 | 7.88 | N.D. | 1.16 | 0.13 | 0.75 | 0.28 | 0.17 | N.D. | 0.09 |
| Petrale Sole | 8/22/2014 | 370.6 | 247.16 | 5.97 | N.D. | 0.88 | 0.44 | 0.62 | 0.18 | 0.13 | 0.01 | 0.08 |
| Black Cod | 9/3/2014 | 270.1 | 250.67 | 7.08 | N.D. | 1.08 | 0.67 | 0.81 | N.D. | 0.13 | 0 | 0.08 |
| Petrale Sole | 10/3/2014 | 476.7 | 159.3 | 4.21 | N.D. | 0.53 | N.D. | 0.27 | 0.04 | 0.06 | 0.02 | 0.04 |
| Petrale Sole | 10/15/2014 | 368.4 | 204.61 | 5.44 | N.D. | 0.66 | N.D. | 0.37 | N.D. | 0.07 | 0.01 | 0.05 |
| Petrale Sole | 1/28/2015 | 340.6 | 240.16 | 6.15 | 0.06 | 0.95 | N.D. | 0.65 | 0.24 | 0.15 | 0.03 | 0.08 |
| Petrale Sole | 12/18/2014 | 466.8 | 217.83 | 5.04 | 0.3 | 0.71 | 0.2 | 0.49 | 0.17 | 0.11 | N.D. | 0.06 |
| Petrale Sole | 1/26/2015 | 373.1 | 122.78 | 4.33 | 0.64 | 0.83 | 0.36 | 0.6 | N.D. | 0.1 | N.D. | 0.07 |
| Petrale Sole | 1/20/2015 | 486.3 | 220.53 | 4.9 | 0.12 | 0.68 | 0.09 | 0.47 | 0.31 | 0.14 | 0.02 | 0.06 |
| Pacific Cod | 2/20/2015 | 331.8 | 239.3 | 6.21 | N.D. | 0.96 | 0.52 | 0.67 | 0.16 | 0.14 | 0.04 | 0.08 |
| Pacific Cod | 3/3/2015 | 297 | 248.86 | 6.73 | N.D. | 1.03 | 0.22 | 0.73 | 0.34 | 0.18 | 0.01 | 0.08 |
| Pacific Cod | 3/11/2015 | 213.3 | 460.32 | 10.75 | 0.44 | 1.61 | 0.94 | 1.11 | 0.52 | 0.28 | N.D. | 0.15 |
| Pacific Cod | 4/13/2015 | 332.8 | 228.75 | 6.1 | N.D. | 1.01 | 0.38 | 0.7 | 0.35 | 0.19 | N.D. | 0.09 |
| Pacific Cod | 4/15/2015 | 407.6 | 199.04 | 5.12 | N.D. | 0.76 | 0.09 | 0.55 | 0.41 | 0.17 | N.D. | 0.07 |
| Pacific Cod | 5/15/2015 | 216.8 | 519.74 | 11.3 | 0.03 | 1.49 | N.D. | 1.01 | 0.77 | 0.33 | 0 | 0.12 |
| Petrale Sole | 5/23/2015 | 352.3 | 369.4 | 7.48 | 0.26 | 1 | N.D. | 0.65 | 0.35 | 0.18 | 0.07 | 0.09 |
| Halibut | 6/8/2015 | 188.7 | 596.08 | 13 | 0.09 | 1.84 | N.D. | 1.23 | 0.2 | 0.25 | 0 | 0.16 |
| Wild King Salmon | 6/14/2015 | 303.2 | 259.89 | 6.78 | N.D. | 1.07 | 0.09 | 0.73 | 0.38 | 0.19 | N.D. | 0.1 |
| Pacific Cod | 6/26/2015 | 364.6 | 277.97 | 6.37 | N.D. | 0.9 | 0.24 | 0.64 | 0.39 | 0.18 | 0.05 | 0.08 |
| Petrale Sole | 7/28/2015 | 299.3 | 316.26 | 7.48 | N.D. | 0.97 | N.D. | 0.66 | 0.18 | 0.14 | N.D. | 0.08 |
| Wild King Salmon | 8/9/2015 | 251.9 | 400.73 | 9.2 | N.D. | 1.33 | 0.48 | 0.92 | 0.26 | 0.2 | 0.06 | 0.13 |
| Halibut | 11/20/2015 | 383.7 | 283.1 | 6.26 | 0.22 | 0.9 | N.D. | 0.58 | 0.05 | 0.12 | N.D. | 0.08 |
| Halibut | 6/2/2016 | 228.3 | 564.35 | 11.07 | 0.23 | 1.48 | 0 | 0.95 | 0.37 | 0.23 | 0.15 | 0.15 |
| Halibut | 6/6/2016 | 186.4 | 623.4 | 12.87 | N.D. | 1.73 | N.D. | 1.15 | 0.4 | 0.27 | 0.14 | 0.17 |
| SwordFish | 6/20/2016 | 340.4 | 466.58 | 8.3 | N.D. | 1.01 | N.D. | 0.64 | 0.45 | 0.2 | N.D. | 0.08 |
| Shrimp | 6/21/2016 | 207.2 | 240.97 | 7.81 | 0 | 1.49 | 0.45 | 1.05 | N.D. | 0.19 | 0.07 | 0.13 |
| Squid | 11/21/2016 | 117.7 | 40.4 | 6.85 | 0.39 | 2.41 | N.D. | 1.72 | N.D. | 0.3 | 0.06 | 0.19 |
| Yellowtail | 11/23/2016 | 231.7 | 530.79 | 10.67 | 0.56 | 1.46 | 0.35 | 0.95 | 0.36 | 0.23 | N.D. | 0.12 |
| Rock Cod | 11/24/2016 | 180.6 | 806.05 | 14.92 | 0.51 | 1.92 | 0.34 | 1.22 | 1.05 | 0.44 | 0.09 | 0.17 |
| Sturgeon | 11/26/2016 | 291.3 | 399.72 | 8.24 | 0.11 | 1.13 | N.D. | 0.75 | 0.02 | 0.14 | 0.1 | 0.11 |
| Branzino | 11/27/2016 | 275.3 | 495.6 | 9.46 | 0.04 | 1.23 | N.D. | 0.81 | 0.55 | 0.25 | 0.04 | 0.1 |
| Catfish | 11/28/2016 | 239.1 | 507.53 | 10.27 | N.D. | 1.4 | N.D. | 0.89 | 0.15 | 0.18 | 0.05 | 0.12 |
| Rock Cod | 11/29/2016 | 167.6 | 547.46 | 12.75 | N.D. | 1.92 | N.D. | 1.28 | 0.6 | 0.33 | 0.1 | 0.16 |
| Rock Cod | 11/30/2016 | 152.2 | 635.03 | 14.4 | 1.69 | 2.18 | 0.5 | 1.43 | 0.6 | 0.35 | 0.04 | 0.18 |
| Rock Cod | 12/3/2016 | 200.4 | 464.48 | 10.73 | 3.09 | 1.72 | 0.5 | 1.1 | 0.53 | 0.28 | 0.1 | 0.15 |
| Rock Cod | 12/5/2016 | 161.9 | 647.95 | 14.09 | 0.15 | 2.03 | N.D. | 1.32 | 0.83 | 0.4 | 0.08 | 0.17 |
| Tilapia | 12/18/2016 | 221.7 | 622.33 | 11.82 | 0.87 | 1.58 | 0.05 | 1 | 0.08 | 0.2 | -0.05 | 0.13 |
| Butterfish | 12/19/2016 | 275.7 | 435.13 | 8.84 | 0.43 | 1.23 | N.D. | 0.77 | 0.28 | 0.19 | 0.05 | 0.1 |
The results found are consistent with expectations, and do not contain measurable amounts of Cs-134 that would indicate contamination from Fukushima. In all of the samples, the spectrum is dominated by the naturally occurring Potassium-40. As expected from aquatic samples, the decay products from the natural heavy metal uranium and thorium series are undetectable. And finally some of the samples contain small amounts of Cesium-137. It seems from the data that common amounts of Cesium-137 are very close our detectability limit, around 0.1 to 0.05 Bq/kg.
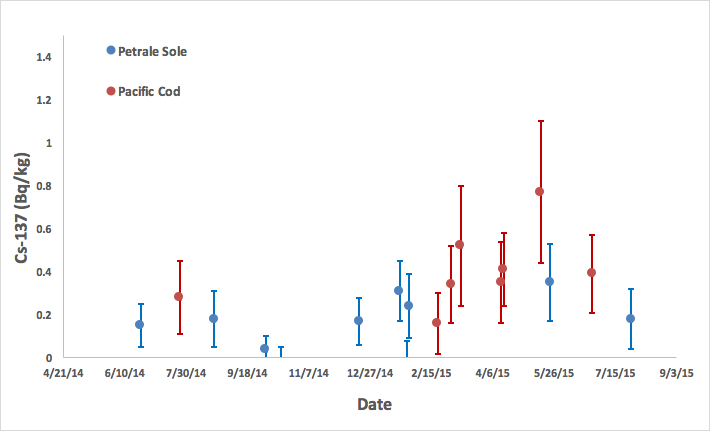
In the case of Pacific Cod and Petrale Sole, we have taken measurements several times with a time-span of more than a year between summer 2014 and fall 2015. To see the trend over time in the rates for Cesium-137, we've plotted these results together in Figure 5. There is no clear trend over time. Future measurements will be added to improve on this study.
 |
|
Fig 5. Time dependence of the Cs-137 rates in Pacific Cod (red) and Petrale Sole (blue).< |
Which isotopes would indicate Fukushima contaminents?
The reactor inventory in Fukushima contained many different radioisotopes, however there are very few that are significant and unique to Fukushima. Cesium-134 (Cs-134) is the clearest indicator of radioactivity from the accident, because it is only produced in nuclear reactors through the activation of beta-delayed reactor products. It also has a relatively short half-life (2 years), which means that Cs-134 from e.g. the 1986 Chernobyl accident are no longer present in measurable quantities.
On the other hand, cesium-137 is not a specific indicator of Fukushima, because it was also a product of atmospheric nuclear weapon tests from 1945 to ~1980, as well as Chernobyl, and it has a 30-year half-life.
We have not measured Cs-134 since 2012. Our measurements show the environmental variations in NORM and TENORM, and place limits on what concentration of Cs-134 might possibly be present in the samples.
What is a 'Reference Sample'?
Reference samples are those which are expected to be unaffected by any possible contamination from Fukushima (Summarized in Figure 4). They represent natural levels of radiation found in our environment, for comparison. These include everyday items and are not a part of the Fukushima Monitoring efforts. These naturally occurring radioactive materials (NORM) help provide context for our environmental sample measurements.
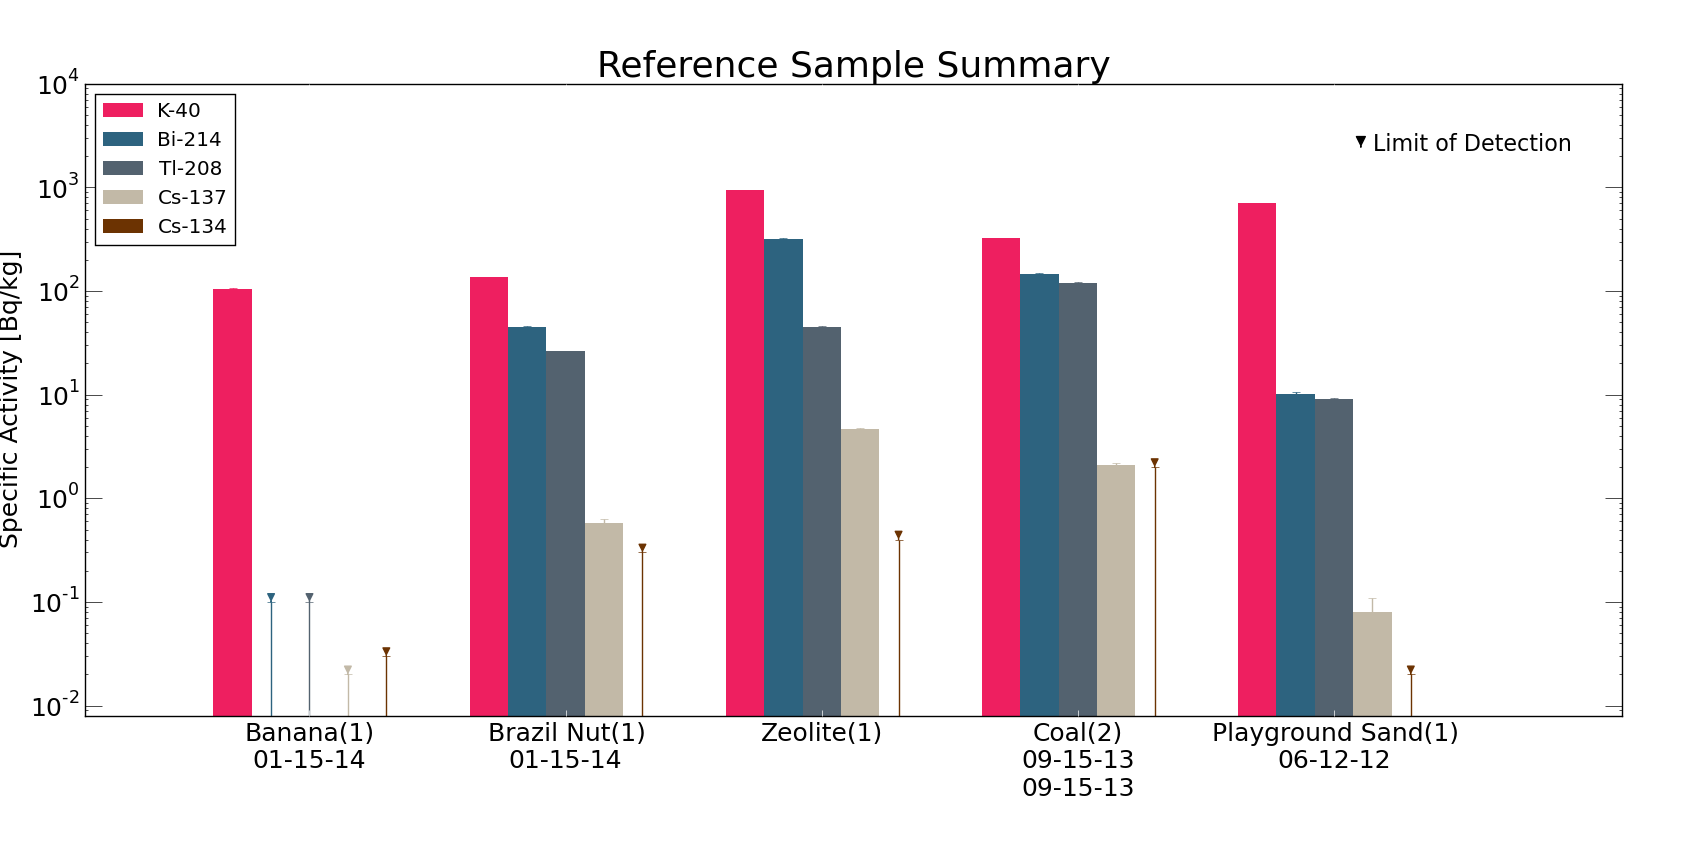
Fig 4. Summary figure of the current sampling data "Reference Samples" that is presented in tables below.
Reference Samples
This set of measurements, as mentioned before, is an eclectic grouping of samples that were obtained in different ways to provide perspective on some of the numbers above, illustrating the scale of radioactivity present in nature. The produce samples were purchased at the grocery store, the sand taken from a local playground, and the coal was brought in.
As before, the potassium is the largest contributor to the observed radiation. The geological samples have predictably much higher concentrations of natural uranium and thorium decay products. This higher concentration can also be seen in the Brazil nuts to a lesser extent. The zeolite, a heavy metal concentrator, possesses the largest amount of Cesium-137 of any of the samples. And as before, none of the reference samples show the Cesium-134 that would indicate contamination from Fukushima.
The reference sample results are based on the previous version of analysis, due to current limitations in the new automated code.
Technical Details
For details on how samples are collected and prepared, how the spectra are obtained and the procedure for determining activity, check out our Sampling Methods page.
Acknowledgements
The most recent data presented here was collected and analyzed by Christopher Figueroa, Jacqueline Garcia, and Mustapha Saad, under the supervision of Dr. Brian Plimley.
Earlier itterations of these results were analyzed by Mark Swanson, Lauren Janney, under the supervision of Dr. Mark Bandstra.
If you have any questions or want additional information, please Contact Us
Data from 2011-2012
Looking for the BRAWM data from 2011-2012?
Related Articles

